
Brief introduction to object-oriented programming
Contents
Brief introduction to object-oriented programming#
Object-oriented programming (OOP) is a substantial topic. One could take an entire yearlong course learning the theory of object-oriented programming. In this short notebook, we will just briefly introduce some aspects of object-oriented programming in the context of Python.
Examples#
In this section, we will review two examples of object-oriented programming we have already seen earlier in the course.
The first example that comes to mind is our way of plotting in Matplotlib.
import matplotlib.pyplot as plt
Here is the non-object oriented programming approach to plotting in Matplotlib. (This is called the state-based interface.)
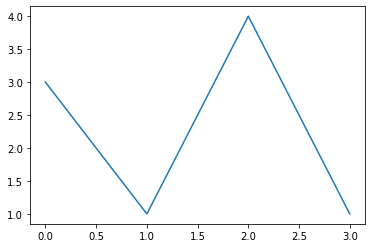
plt.plot([3,1,4,1])
[<matplotlib.lines.Line2D at 0x114d0c0d0>]
Here is the object-oriented approach.
fig, ax = plt.subplots()
ax.plot([3,1,4,1])
[<matplotlib.lines.Line2D at 0x114eb5a80>]

The two approaches look very similar. In the state-based interface, we call plt.plot, in the object-oriented interface, we call ax.plot.
Notice the first sentence in the help documentation for plt.plot.
Help on function plot in module matplotlib.pyplot
help(plt.plot)
Help on function plot in module matplotlib.pyplot:

plot(*args, scalex=True, scaley=True, data=None, **kwargs)
    Plot y versus x as lines and/or markers.

    Call signatures::

        plot([x], y, [fmt], *, data=None, **kwargs)
        plot([x], y, [fmt], [x2], y2, [fmt2], ..., **kwargs)

    The coordinates of the points or line nodes are given by *x*, *y*.

    The optional parameter *fmt* is a convenient way for defining basic
    formatting like color, marker and linestyle. It's a shortcut string
    notation described in the *Notes* section below.

    >>> plot(x, y)        # plot x and y using default line style and color
    >>> plot(x, y, 'bo')  # plot x and y using blue circle markers
    >>> plot(y)           # plot y using x as index array 0..N-1
    >>> plot(y, 'r+')     # ditto, but with red plusses

    You can use `.Line2D` properties as keyword arguments for more
    control on the appearance. Line properties and *fmt* can be mixed.
    The following two calls yield identical results:

    >>> plot(x, y, 'go--', linewidth=2, markersize=12)
    >>> plot(x, y, color='green', marker='o', linestyle='dashed',
    ...      linewidth=2, markersize=12)

    When conflicting with *fmt*, keyword arguments take precedence.


    **Plotting labelled data**

    There's a convenient way for plotting objects with labelled data (i.e.
    data that can be accessed by index ``obj['y']``). Instead of giving
    the data in *x* and *y*, you can provide the object in the *data*
    parameter and just give the labels for *x* and *y*::

    >>> plot('xlabel', 'ylabel', data=obj)

    All indexable objects are supported. This could e.g. be a `dict`, a
    `pandas.DataFrame` or a structured numpy array.


    **Plotting multiple sets of data**

    There are various ways to plot multiple sets of data.

    - The most straight forward way is just to call `plot` multiple times.
      Example:

      >>> plot(x1, y1, 'bo')
      >>> plot(x2, y2, 'go')

    - If *x* and/or *y* are 2D arrays a separate data set will be drawn
      for every column. If both *x* and *y* are 2D, they must have the
      same shape. If only one of them is 2D with shape (N, m) the other
      must have length N and will be used for every data set m.

      Example:

      >>> x = [1, 2, 3]
      >>> y = np.array([[1, 2], [3, 4], [5, 6]])
      >>> plot(x, y)

      is equivalent to:

      >>> for col in range(y.shape[1]):
      ...     plot(x, y[:, col])

    - The third way is to specify multiple sets of *[x]*, *y*, *[fmt]*
      groups::

      >>> plot(x1, y1, 'g^', x2, y2, 'g-')

      In this case, any additional keyword argument applies to all
      datasets. Also this syntax cannot be combined with the *data*
      parameter.

    By default, each line is assigned a different style specified by a
    'style cycle'. The *fmt* and line property parameters are only
    necessary if you want explicit deviations from these defaults.
    Alternatively, you can also change the style cycle using
    :rc:`axes.prop_cycle`.


    Parameters
    ----------
    x, y : array-like or scalar
        The horizontal / vertical coordinates of the data points.
        *x* values are optional and default to ``range(len(y))``.

        Commonly, these parameters are 1D arrays.

        They can also be scalars, or two-dimensional (in that case, the
        columns represent separate data sets).

        These arguments cannot be passed as keywords.

    fmt : str, optional
        A format string, e.g. 'ro' for red circles. See the *Notes*
        section for a full description of the format strings.

        Format strings are just an abbreviation for quickly setting
        basic line properties. All of these and more can also be
        controlled by keyword arguments.

        This argument cannot be passed as keyword.

    data : indexable object, optional
        An object with labelled data. If given, provide the label names to
        plot in *x* and *y*.

        .. note::
            Technically there's a slight ambiguity in calls where the
            second label is a valid *fmt*. ``plot('n', 'o', data=obj)``
            could be ``plt(x, y)`` or ``plt(y, fmt)``. In such cases,
            the former interpretation is chosen, but a warning is issued.
            You may suppress the warning by adding an empty format string
            ``plot('n', 'o', '', data=obj)``.

    Returns
    -------
    list of `.Line2D`
        A list of lines representing the plotted data.

    Other Parameters
    ----------------
    scalex, scaley : bool, default: True
        These parameters determine if the view limits are adapted to the
        data limits. The values are passed on to `autoscale_view`.

    **kwargs : `.Line2D` properties, optional
        *kwargs* are used to specify properties like a line label (for
        auto legends), linewidth, antialiasing, marker face color.
        Example::

        >>> plot([1, 2, 3], [1, 2, 3], 'go-', label='line 1', linewidth=2)
        >>> plot([1, 2, 3], [1, 4, 9], 'rs', label='line 2')

        If you specify multiple lines with one plot call, the kwargs apply
        to all those lines. In case the label object is iterable, each
        element is used as labels for each set of data.

        Here is a list of available `.Line2D` properties:

        Properties:
        agg_filter: a filter function, which takes a (m, n, 3) float array and a dpi value, and returns a (m, n, 3) array
        alpha: scalar or None
        animated: bool
        antialiased or aa: bool
        clip_box: `.Bbox`
        clip_on: bool
        clip_path: Patch or (Path, Transform) or None
        color or c: color
        dash_capstyle: `.CapStyle` or {'butt', 'projecting', 'round'}
        dash_joinstyle: `.JoinStyle` or {'miter', 'round', 'bevel'}
        dashes: sequence of floats (on/off ink in points) or (None, None)
        data: (2, N) array or two 1D arrays
        drawstyle or ds: {'default', 'steps', 'steps-pre', 'steps-mid', 'steps-post'}, default: 'default'
        figure: `.Figure`
        fillstyle: {'full', 'left', 'right', 'bottom', 'top', 'none'}
        gid: str
        in_layout: bool
        label: object
        linestyle or ls: {'-', '--', '-.', ':', '', (offset, on-off-seq), ...}
        linewidth or lw: float
        marker: marker style string, `~.path.Path` or `~.markers.MarkerStyle`
        markeredgecolor or mec: color
        markeredgewidth or mew: float
        markerfacecolor or mfc: color
        markerfacecoloralt or mfcalt: color
        markersize or ms: float
        markevery: None or int or (int, int) or slice or list[int] or float or (float, float) or list[bool]
        path_effects: `.AbstractPathEffect`
        picker: float or callable[[Artist, Event], tuple[bool, dict]]
        pickradius: float
        rasterized: bool
        sketch_params: (scale: float, length: float, randomness: float)
        snap: bool or None
        solid_capstyle: `.CapStyle` or {'butt', 'projecting', 'round'}
        solid_joinstyle: `.JoinStyle` or {'miter', 'round', 'bevel'}
        transform: unknown
        url: str
        visible: bool
        xdata: 1D array
        ydata: 1D array
        zorder: float

    See Also
    --------
    scatter : XY scatter plot with markers of varying size and/or color (
        sometimes also called bubble chart).

    Notes
    -----
    **Format Strings**

    A format string consists of a part for color, marker and line::

        fmt = '[marker][line][color]'

    Each of them is optional. If not provided, the value from the style
    cycle is used. Exception: If ``line`` is given, but no ``marker``,
    the data will be a line without markers.

    Other combinations such as ``[color][marker][line]`` are also
    supported, but note that their parsing may be ambiguous.

    **Markers**

    =============   ===============================
    character       description
    =============   ===============================
    ``'.'``         point marker
    ``','``         pixel marker
    ``'o'``         circle marker
    ``'v'``         triangle_down marker
    ``'^'``         triangle_up marker
    ``'<'``         triangle_left marker
    ``'>'``         triangle_right marker
    ``'1'``         tri_down marker
    ``'2'``         tri_up marker
    ``'3'``         tri_left marker
    ``'4'``         tri_right marker
    ``'8'``         octagon marker
    ``'s'``         square marker
    ``'p'``         pentagon marker
    ``'P'``         plus (filled) marker
    ``'*'``         star marker
    ``'h'``         hexagon1 marker
    ``'H'``         hexagon2 marker
    ``'+'``         plus marker
    ``'x'``         x marker
    ``'X'``         x (filled) marker
    ``'D'``         diamond marker
    ``'d'``         thin_diamond marker
    ``'|'``         vline marker
    ``'_'``         hline marker
    =============   ===============================

    **Line Styles**

    =============    ===============================
    character        description
    =============    ===============================
    ``'-'``          solid line style
    ``'--'``         dashed line style
    ``'-.'``         dash-dot line style
    ``':'``          dotted line style
    =============    ===============================

    Example format strings::

        'b'    # blue markers with default shape
        'or'   # red circles
        '-g'   # green solid line
        '--'   # dashed line with default color
        '^k:'  # black triangle_up markers connected by a dotted line

    **Colors**

    The supported color abbreviations are the single letter codes

    =============    ===============================
    character        color
    =============    ===============================
    ``'b'``          blue
    ``'g'``          green
    ``'r'``          red
    ``'c'``          cyan
    ``'m'``          magenta
    ``'y'``          yellow
    ``'k'``          black
    ``'w'``          white
    =============    ===============================

    and the ``'CN'`` colors that index into the default property cycle.

    If the color is the only part of the format string, you can
    additionally use any  `matplotlib.colors` spec, e.g. full names
    (``'green'``) or hex strings (``'#008000'``).
Compare that to the the documentation for ax.plot:
plot(*args, ...)method ofmatplotlib.axes._subplots.AxesSubplotinstance
It is a subtle difference. The first, plt.plot, is a stand-alone function defined by pyplot. The second, ax.plot, is a method attached to a specific object, ax. The object-oriented approach probably seems less natural when you first encounter it, but once you get used to it, the object-oriented approach can make complex tasks significantly more streamlined. (In the next section, we will see how using a more specialized object than a string can also simplify a relatively straightforward task.)
type(ax)
matplotlib.axes._subplots.AxesSubplot
help(ax.plot)
Help on method plot in module matplotlib.axes._axes:

plot(*args, scalex=True, scaley=True, data=None, **kwargs) method of matplotlib.axes._subplots.AxesSubplot instance
    Plot y versus x as lines and/or markers.

    Call signatures::

        plot([x], y, [fmt], *, data=None, **kwargs)
        plot([x], y, [fmt], [x2], y2, [fmt2], ..., **kwargs)

    The coordinates of the points or line nodes are given by *x*, *y*.

    The optional parameter *fmt* is a convenient way for defining basic
    formatting like color, marker and linestyle. It's a shortcut string
    notation described in the *Notes* section below.

    >>> plot(x, y)        # plot x and y using default line style and color
    >>> plot(x, y, 'bo')  # plot x and y using blue circle markers
    >>> plot(y)           # plot y using x as index array 0..N-1
    >>> plot(y, 'r+')     # ditto, but with red plusses

    You can use `.Line2D` properties as keyword arguments for more
    control on the appearance. Line properties and *fmt* can be mixed.
    The following two calls yield identical results:

    >>> plot(x, y, 'go--', linewidth=2, markersize=12)
    >>> plot(x, y, color='green', marker='o', linestyle='dashed',
    ...      linewidth=2, markersize=12)

    When conflicting with *fmt*, keyword arguments take precedence.


    **Plotting labelled data**

    There's a convenient way for plotting objects with labelled data (i.e.
    data that can be accessed by index ``obj['y']``). Instead of giving
    the data in *x* and *y*, you can provide the object in the *data*
    parameter and just give the labels for *x* and *y*::

    >>> plot('xlabel', 'ylabel', data=obj)

    All indexable objects are supported. This could e.g. be a `dict`, a
    `pandas.DataFrame` or a structured numpy array.


    **Plotting multiple sets of data**

    There are various ways to plot multiple sets of data.

    - The most straight forward way is just to call `plot` multiple times.
      Example:

      >>> plot(x1, y1, 'bo')
      >>> plot(x2, y2, 'go')

    - If *x* and/or *y* are 2D arrays a separate data set will be drawn
      for every column. If both *x* and *y* are 2D, they must have the
      same shape. If only one of them is 2D with shape (N, m) the other
      must have length N and will be used for every data set m.

      Example:

      >>> x = [1, 2, 3]
      >>> y = np.array([[1, 2], [3, 4], [5, 6]])
      >>> plot(x, y)

      is equivalent to:

      >>> for col in range(y.shape[1]):
      ...     plot(x, y[:, col])

    - The third way is to specify multiple sets of *[x]*, *y*, *[fmt]*
      groups::

      >>> plot(x1, y1, 'g^', x2, y2, 'g-')

      In this case, any additional keyword argument applies to all
      datasets. Also this syntax cannot be combined with the *data*
      parameter.

    By default, each line is assigned a different style specified by a
    'style cycle'. The *fmt* and line property parameters are only
    necessary if you want explicit deviations from these defaults.
    Alternatively, you can also change the style cycle using
    :rc:`axes.prop_cycle`.


    Parameters
    ----------
    x, y : array-like or scalar
        The horizontal / vertical coordinates of the data points.
        *x* values are optional and default to ``range(len(y))``.

        Commonly, these parameters are 1D arrays.

        They can also be scalars, or two-dimensional (in that case, the
        columns represent separate data sets).

        These arguments cannot be passed as keywords.

    fmt : str, optional
        A format string, e.g. 'ro' for red circles. See the *Notes*
        section for a full description of the format strings.

        Format strings are just an abbreviation for quickly setting
        basic line properties. All of these and more can also be
        controlled by keyword arguments.

        This argument cannot be passed as keyword.

    data : indexable object, optional
        An object with labelled data. If given, provide the label names to
        plot in *x* and *y*.

        .. note::
            Technically there's a slight ambiguity in calls where the
            second label is a valid *fmt*. ``plot('n', 'o', data=obj)``
            could be ``plt(x, y)`` or ``plt(y, fmt)``. In such cases,
            the former interpretation is chosen, but a warning is issued.
            You may suppress the warning by adding an empty format string
            ``plot('n', 'o', '', data=obj)``.

    Returns
    -------
    list of `.Line2D`
        A list of lines representing the plotted data.

    Other Parameters
    ----------------
    scalex, scaley : bool, default: True
        These parameters determine if the view limits are adapted to the
        data limits. The values are passed on to `autoscale_view`.

    **kwargs : `.Line2D` properties, optional
        *kwargs* are used to specify properties like a line label (for
        auto legends), linewidth, antialiasing, marker face color.
        Example::

        >>> plot([1, 2, 3], [1, 2, 3], 'go-', label='line 1', linewidth=2)
        >>> plot([1, 2, 3], [1, 4, 9], 'rs', label='line 2')

        If you specify multiple lines with one plot call, the kwargs apply
        to all those lines. In case the label object is iterable, each
        element is used as labels for each set of data.

        Here is a list of available `.Line2D` properties:

        Properties:
        agg_filter: a filter function, which takes a (m, n, 3) float array and a dpi value, and returns a (m, n, 3) array
        alpha: scalar or None
        animated: bool
        antialiased or aa: bool
        clip_box: `.Bbox`
        clip_on: bool
        clip_path: Patch or (Path, Transform) or None
        color or c: color
        dash_capstyle: `.CapStyle` or {'butt', 'projecting', 'round'}
        dash_joinstyle: `.JoinStyle` or {'miter', 'round', 'bevel'}
        dashes: sequence of floats (on/off ink in points) or (None, None)
        data: (2, N) array or two 1D arrays
        drawstyle or ds: {'default', 'steps', 'steps-pre', 'steps-mid', 'steps-post'}, default: 'default'
        figure: `.Figure`
        fillstyle: {'full', 'left', 'right', 'bottom', 'top', 'none'}
        gid: str
        in_layout: bool
        label: object
        linestyle or ls: {'-', '--', '-.', ':', '', (offset, on-off-seq), ...}
        linewidth or lw: float
        marker: marker style string, `~.path.Path` or `~.markers.MarkerStyle`
        markeredgecolor or mec: color
        markeredgewidth or mew: float
        markerfacecolor or mfc: color
        markerfacecoloralt or mfcalt: color
        markersize or ms: float
        markevery: None or int or (int, int) or slice or list[int] or float or (float, float) or list[bool]
        path_effects: `.AbstractPathEffect`
        picker: float or callable[[Artist, Event], tuple[bool, dict]]
        pickradius: float
        rasterized: bool
        sketch_params: (scale: float, length: float, randomness: float)
        snap: bool or None
        solid_capstyle: `.CapStyle` or {'butt', 'projecting', 'round'}
        solid_joinstyle: `.JoinStyle` or {'miter', 'round', 'bevel'}
        transform: unknown
        url: str
        visible: bool
        xdata: 1D array
        ydata: 1D array
        zorder: float

    See Also
    --------
    scatter : XY scatter plot with markers of varying size and/or color (
        sometimes also called bubble chart).

    Notes
    -----
    **Format Strings**

    A format string consists of a part for color, marker and line::

        fmt = '[marker][line][color]'

    Each of them is optional. If not provided, the value from the style
    cycle is used. Exception: If ``line`` is given, but no ``marker``,
    the data will be a line without markers.

    Other combinations such as ``[color][marker][line]`` are also
    supported, but note that their parsing may be ambiguous.

    **Markers**

    =============   ===============================
    character       description
    =============   ===============================
    ``'.'``         point marker
    ``','``         pixel marker
    ``'o'``         circle marker
    ``'v'``         triangle_down marker
    ``'^'``         triangle_up marker
    ``'<'``         triangle_left marker
    ``'>'``         triangle_right marker
    ``'1'``         tri_down marker
    ``'2'``         tri_up marker
    ``'3'``         tri_left marker
    ``'4'``         tri_right marker
    ``'8'``         octagon marker
    ``'s'``         square marker
    ``'p'``         pentagon marker
    ``'P'``         plus (filled) marker
    ``'*'``         star marker
    ``'h'``         hexagon1 marker
    ``'H'``         hexagon2 marker
    ``'+'``         plus marker
    ``'x'``         x marker
    ``'X'``         x (filled) marker
    ``'D'``         diamond marker
    ``'d'``         thin_diamond marker
    ``'|'``         vline marker
    ``'_'``         hline marker
    =============   ===============================

    **Line Styles**

    =============    ===============================
    character        description
    =============    ===============================
    ``'-'``          solid line style
    ``'--'``         dashed line style
    ``'-.'``         dash-dot line style
    ``':'``          dotted line style
    =============    ===============================

    Example format strings::

        'b'    # blue markers with default shape
        'or'   # red circles
        '-g'   # green solid line
        '--'   # dashed line with default color
        '^k:'  # black triangle_up markers connected by a dotted line

    **Colors**

    The supported color abbreviations are the single letter codes

    =============    ===============================
    character        color
    =============    ===============================
    ``'b'``          blue
    ``'g'``          green
    ``'r'``          red
    ``'c'``          cyan
    ``'m'``          magenta
    ``'y'``          yellow
    ``'k'``          black
    ``'w'``          white
    =============    ===============================

    and the ``'CN'`` colors that index into the default property cycle.

    If the color is the only part of the format string, you can
    additionally use any  `matplotlib.colors` spec, e.g. full names
    (``'green'``) or hex strings (``'#008000'``).
Another situation where we have seen the object-oriented approach was when producing random numbers in NumPy. Before I learned this approach, I would have expected that there was some stand-alone function to produce random numbers. Instead of using functions, we use methods which are attached to a random number generator object.
import numpy as np
Here we are instantiating (“creating an instance of”) a random number generator.
rng = np.random.default_rng()
In this case, the object in our object-oriented programming is a Generator object.
type(rng)
numpy.random._generator.Generator
This next line, rng.random(5), is calling the random method of the object rng.
rng.random(5)
array([0.09166737, 0.4150235 , 0.24720181, 0.40595135, 0.69774883])
Again, if we read the beginning of the help documentation for rng.random, we see the language reinforcing that we are using the object-oriented approach.
random(…) method of
numpy.random._generator.Generatorinstance
In our specific case, rng is the numpy.random._generator.Generator instance, and we are calling its random method to produce a length-5 array of random numbers.
help(rng.random)
Help on built-in function random:

random(...) method of numpy.random._generator.Generator instance
    random(size=None, dtype=np.float64, out=None)

    Return random floats in the half-open interval [0.0, 1.0).

    Results are from the "continuous uniform" distribution over the
    stated interval.  To sample :math:`Unif[a, b), b > a` multiply
    the output of `random` by `(b-a)` and add `a`::

      (b - a) * random() + a

    Parameters
    ----------
    size : int or tuple of ints, optional
        Output shape.  If the given shape is, e.g., ``(m, n, k)``, then
        ``m * n * k`` samples are drawn.  Default is None, in which case a
        single value is returned.
    dtype : dtype, optional
        Desired dtype of the result, only `float64` and `float32` are supported.
        Byteorder must be native. The default value is np.float64.
    out : ndarray, optional
        Alternative output array in which to place the result. If size is not None,
        it must have the same shape as the provided size and must match the type of
        the output values.

    Returns
    -------
    out : float or ndarray of floats
        Array of random floats of shape `size` (unless ``size=None``, in which
        case a single float is returned).

    Examples
    --------
    >>> rng = np.random.default_rng()
    >>> rng.random()
    0.47108547995356098 # random
    >>> type(rng.random())
    <class 'float'>
    >>> rng.random((5,))
    array([ 0.30220482,  0.86820401,  0.1654503 ,  0.11659149,  0.54323428]) # random

    Three-by-two array of random numbers from [-5, 0):

    >>> 5 * rng.random((3, 2)) - 5
    array([[-3.99149989, -0.52338984], # random
           [-2.99091858, -0.79479508],
           [-1.23204345, -1.75224494]])
In summary, those were two examples of where we have used the object-oriented approach earlier in the class. In ax.plot, the ax was the object. In rng.random, the rng was the object.
In the next section, we will see how the pathlib library (which we have not yet seen), and its object-oriented approach, simplifies some tasks in comparison to the functions available to us from the os library.
os vs. pathlib#
Here is a relatively straightforward task:
Find all files (as opposed to folders) in
/Users/christopherdavis/Documents/GitHub/UCI-Math-9-F22.
Based on what we have seen so far, the os module is the most obvious tool to use for accomplishing this task. We will see, however, that by instead using the pathlib module, we can accomplish the task more easily. The reason pathlib makes this task easier is because it utilizes an object-oriented approach.
But let’s start by seeing how we would start work on this task using os.
import os
The obvious function to use is os.listdir.
os.listdir("/Users/christopherdavis/Documents/GitHub/UCI-Math-9-F22")
['.DS_Store',
 'Week1',
 'LICENSE',
 'images',
 'intro.md',
 '_toc.yml',
 '.gitignore',
 'Week2',
 '_build',
 '_config.yml',
 '.gitattributes',
 'Week4',
 '.git']
Which of these represent files and which represent folders? For example, are you confident whether ".gitignore" is a file or a folder? What about "LICENSE"? What about "_build"?
Let’s save the list returned by os.listdir.
mylist = os.listdir("/Users/christopherdavis/Documents/GitHub/UCI-Math-9-F22")
There is certainly no method we can call on any of these objects to determine if these represent files or folders, because they are just strings. Let’s verify that they really are nothing more than strings using list comprehension.
[type(x) for x in mylist]
[str, str, str, str, str, str, str, str, str, str, str, str, str]
Our lives would be much easier if, instead of returning a list of plain strings, os.listdir returned a list of some more specialized objects on which we could call a method to help us determine if they represent files or folders. If you agree that would make things easier, then you already have a good intuition for the simplifications provided by the object-oriented approach.
There is an alternative to os.listdir that we can access using a different library, pathlib. The module pathlib is a relatively recent addition to Python: it was introduced to Python in Python 3.4, and currently (in Summer 2022) these notes are being written using Python 3.10.
Similarly to how we only imported Image from PIL, we will only import Path from pathlib. This will give us access to a new type of object, Path objects.
from pathlib import Path
The syntax shown in the documentation, class Path(PurePath), is an indication of how new types of objects are defined in Python. (We will define our own new types of objects in the next section.)
help(Path)
Help on class Path in module pathlib:

class Path(PurePath)
 |  Path(*args, **kwargs)
 |
 |  PurePath subclass that can make system calls.
 |
 |  Path represents a filesystem path but unlike PurePath, also offers
 |  methods to do system calls on path objects. Depending on your system,
 |  instantiating a Path will return either a PosixPath or a WindowsPath
 |  object. You can also instantiate a PosixPath or WindowsPath directly,
 |  but cannot instantiate a WindowsPath on a POSIX system or vice versa.
 |
 |  Method resolution order:
 |      Path
 |      PurePath
 |      builtins.object
 |
 |  Methods defined here:
 |
 |  __enter__(self)
 |
 |  __exit__(self, t, v, tb)
 |
 |  absolute(self)
 |      Return an absolute version of this path.  This function works
 |      even if the path doesn't point to anything.
 |
 |      No normalization is done, i.e. all '.' and '..' will be kept along.
 |      Use resolve() to get the canonical path to a file.
 |
 |  chmod(self, mode, *, follow_symlinks=True)
 |      Change the permissions of the path, like os.chmod().
 |
 |  exists(self)
 |      Whether this path exists.
 |
 |  expanduser(self)
 |      Return a new path with expanded ~ and ~user constructs
 |      (as returned by os.path.expanduser)
 |
 |  glob(self, pattern)
 |      Iterate over this subtree and yield all existing files (of any
 |      kind, including directories) matching the given relative pattern.
 |
 |  group(self)
 |      Return the group name of the file gid.
 |
 |  hardlink_to(self, target)
 |      Make this path a hard link pointing to the same file as *target*.
 |
 |      Note the order of arguments (self, target) is the reverse of os.link's.
 |
 |  is_block_device(self)
 |      Whether this path is a block device.
 |
 |  is_char_device(self)
 |      Whether this path is a character device.
 |
 |  is_dir(self)
 |      Whether this path is a directory.
 |
 |  is_fifo(self)
 |      Whether this path is a FIFO.
 |
 |  is_file(self)
 |      Whether this path is a regular file (also True for symlinks pointing
 |      to regular files).
 |
 |  is_mount(self)
 |      Check if this path is a POSIX mount point
 |
 |  is_socket(self)
 |      Whether this path is a socket.
 |
 |  is_symlink(self)
 |      Whether this path is a symbolic link.
 |
 |  iterdir(self)
 |      Iterate over the files in this directory.  Does not yield any
 |      result for the special paths '.' and '..'.
 |
 |  lchmod(self, mode)
 |      Like chmod(), except if the path points to a symlink, the symlink's
 |      permissions are changed, rather than its target's.
 |
 |  link_to(self, target)
 |      Make the target path a hard link pointing to this path.
 |
 |      Note this function does not make this path a hard link to *target*,
 |      despite the implication of the function and argument names. The order
 |      of arguments (target, link) is the reverse of Path.symlink_to, but
 |      matches that of os.link.
 |
 |      Deprecated since Python 3.10 and scheduled for removal in Python 3.12.
 |      Use `hardlink_to()` instead.
 |
 |  lstat(self)
 |      Like stat(), except if the path points to a symlink, the symlink's
 |      status information is returned, rather than its target's.
 |
 |  mkdir(self, mode=511, parents=False, exist_ok=False)
 |      Create a new directory at this given path.
 |
 |  open(self, mode='r', buffering=-1, encoding=None, errors=None, newline=None)
 |      Open the file pointed by this path and return a file object, as
 |      the built-in open() function does.
 |
 |  owner(self)
 |      Return the login name of the file owner.
 |
 |  read_bytes(self)
 |      Open the file in bytes mode, read it, and close the file.
 |
 |  read_text(self, encoding=None, errors=None)
 |      Open the file in text mode, read it, and close the file.
 |
 |  readlink(self)
 |      Return the path to which the symbolic link points.
 |
 |  rename(self, target)
 |      Rename this path to the target path.
 |
 |      The target path may be absolute or relative. Relative paths are
 |      interpreted relative to the current working directory, *not* the
 |      directory of the Path object.
 |
 |      Returns the new Path instance pointing to the target path.
 |
 |  replace(self, target)
 |      Rename this path to the target path, overwriting if that path exists.
 |
 |      The target path may be absolute or relative. Relative paths are
 |      interpreted relative to the current working directory, *not* the
 |      directory of the Path object.
 |
 |      Returns the new Path instance pointing to the target path.
 |
 |  resolve(self, strict=False)
 |      Make the path absolute, resolving all symlinks on the way and also
 |      normalizing it (for example turning slashes into backslashes under
 |      Windows).
 |
 |  rglob(self, pattern)
 |      Recursively yield all existing files (of any kind, including
 |      directories) matching the given relative pattern, anywhere in
 |      this subtree.
 |
 |  rmdir(self)
 |      Remove this directory.  The directory must be empty.
 |
 |  samefile(self, other_path)
 |      Return whether other_path is the same or not as this file
 |      (as returned by os.path.samefile()).
 |
 |  stat(self, *, follow_symlinks=True)
 |      Return the result of the stat() system call on this path, like
 |      os.stat() does.
 |
 |  symlink_to(self, target, target_is_directory=False)
 |      Make this path a symlink pointing to the target path.
 |      Note the order of arguments (link, target) is the reverse of os.symlink.
 |
 |  touch(self, mode=438, exist_ok=True)
 |      Create this file with the given access mode, if it doesn't exist.
 |
 |  unlink(self, missing_ok=False)
 |      Remove this file or link.
 |      If the path is a directory, use rmdir() instead.
 |
 |  write_bytes(self, data)
 |      Open the file in bytes mode, write to it, and close the file.
 |
 |  write_text(self, data, encoding=None, errors=None, newline=None)
 |      Open the file in text mode, write to it, and close the file.
 |
 |  ----------------------------------------------------------------------
 |  Class methods defined here:
 |
 |  cwd() from builtins.type
 |      Return a new path pointing to the current working directory
 |      (as returned by os.getcwd()).
 |
 |  home() from builtins.type
 |      Return a new path pointing to the user's home directory (as
 |      returned by os.path.expanduser('~')).
 |
 |  ----------------------------------------------------------------------
 |  Static methods defined here:
 |
 |  __new__(cls, *args, **kwargs)
 |      Construct a PurePath from one or several strings and or existing
 |      PurePath objects.  The strings and path objects are combined so as
 |      to yield a canonicalized path, which is incorporated into the
 |      new PurePath object.
 |
 |  ----------------------------------------------------------------------
 |  Methods inherited from PurePath:
 |
 |  __bytes__(self)
 |      Return the bytes representation of the path.  This is only
 |      recommended to use under Unix.
 |
 |  __eq__(self, other)
 |      Return self==value.
 |
 |  __fspath__(self)
 |
 |  __ge__(self, other)
 |      Return self>=value.
 |
 |  __gt__(self, other)
 |      Return self>value.
 |
 |  __hash__(self)
 |      Return hash(self).
 |
 |  __le__(self, other)
 |      Return self<=value.
 |
 |  __lt__(self, other)
 |      Return self<value.
 |
 |  __reduce__(self)
 |      Helper for pickle.
 |
 |  __repr__(self)
 |      Return repr(self).
 |
 |  __rtruediv__(self, key)
 |
 |  __str__(self)
 |      Return the string representation of the path, suitable for
 |      passing to system calls.
 |
 |  __truediv__(self, key)
 |
 |  as_posix(self)
 |      Return the string representation of the path with forward (/)
 |      slashes.
 |
 |  as_uri(self)
 |      Return the path as a 'file' URI.
 |
 |  is_absolute(self)
 |      True if the path is absolute (has both a root and, if applicable,
 |      a drive).
 |
 |  is_relative_to(self, *other)
 |      Return True if the path is relative to another path or False.
 |
 |  is_reserved(self)
 |      Return True if the path contains one of the special names reserved
 |      by the system, if any.
 |
 |  joinpath(self, *args)
 |      Combine this path with one or several arguments, and return a
 |      new path representing either a subpath (if all arguments are relative
 |      paths) or a totally different path (if one of the arguments is
 |      anchored).
 |
 |  match(self, path_pattern)
 |      Return True if this path matches the given pattern.
 |
 |  relative_to(self, *other)
 |      Return the relative path to another path identified by the passed
 |      arguments.  If the operation is not possible (because this is not
 |      a subpath of the other path), raise ValueError.
 |
 |  with_name(self, name)
 |      Return a new path with the file name changed.
 |
 |  with_stem(self, stem)
 |      Return a new path with the stem changed.
 |
 |  with_suffix(self, suffix)
 |      Return a new path with the file suffix changed.  If the path
 |      has no suffix, add given suffix.  If the given suffix is an empty
 |      string, remove the suffix from the path.
 |
 |  ----------------------------------------------------------------------
 |  Class methods inherited from PurePath:
 |
 |  __class_getitem__(type) from builtins.type
 |
 |  ----------------------------------------------------------------------
 |  Readonly properties inherited from PurePath:
 |
 |  anchor
 |      The concatenation of the drive and root, or ''.
 |
 |  drive
 |      The drive prefix (letter or UNC path), if any.
 |
 |  name
 |      The final path component, if any.
 |
 |  parent
 |      The logical parent of the path.
 |
 |  parents
 |      A sequence of this path's logical parents.
 |
 |  parts
 |      An object providing sequence-like access to the
 |      components in the filesystem path.
 |
 |  root
 |      The root of the path, if any.
 |
 |  stem
 |      The final path component, minus its last suffix.
 |
 |  suffix
 |      The final component's last suffix, if any.
 |
 |      This includes the leading period. For example: '.txt'
 |
 |  suffixes
 |      A list of the final component's suffixes, if any.
 |
 |      These include the leading periods. For example: ['.tar', '.gz']
In the next line, we are instantiating a new Path object p. Sometimes when we instantiate a new object, like when we call np.random.default_rng(), we do not pass any arguments. In this case, we are passing one argument, the string "/Users/christopherdavis/Documents/GitHub/UCI-Math-9-F22" representing what path we want p to represent.
p = Path("/Users/christopherdavis/Documents/GitHub/UCI-Math-9-F22")
Let’s check the type of p to make sure it really is a new type of object. (I haven’t looked up what PosixPath represents; for now, I’m just thinking of it as the same as Path.)
type(p)
pathlib.PosixPath
This object p has a method iterdir, which is analogous to os.listdir.
p.iterdir()
<generator object Path.iterdir at 0x111159700>
One difference between p.iterdir and os.listdir is that p.iterdir returns what is called a “generator object” as opposed to a list, but it is easy enough to convert that generator into a list.
list(p.iterdir())
[PosixPath('/Users/christopherdavis/Documents/GitHub/UCI-Math-9-F22/.DS_Store'),
 PosixPath('/Users/christopherdavis/Documents/GitHub/UCI-Math-9-F22/Week1'),
 PosixPath('/Users/christopherdavis/Documents/GitHub/UCI-Math-9-F22/LICENSE'),
 PosixPath('/Users/christopherdavis/Documents/GitHub/UCI-Math-9-F22/images'),
 PosixPath('/Users/christopherdavis/Documents/GitHub/UCI-Math-9-F22/intro.md'),
 PosixPath('/Users/christopherdavis/Documents/GitHub/UCI-Math-9-F22/_toc.yml'),
 PosixPath('/Users/christopherdavis/Documents/GitHub/UCI-Math-9-F22/.gitignore'),
 PosixPath('/Users/christopherdavis/Documents/GitHub/UCI-Math-9-F22/Week2'),
 PosixPath('/Users/christopherdavis/Documents/GitHub/UCI-Math-9-F22/_build'),
 PosixPath('/Users/christopherdavis/Documents/GitHub/UCI-Math-9-F22/_config.yml'),
 PosixPath('/Users/christopherdavis/Documents/GitHub/UCI-Math-9-F22/.gitattributes'),
 PosixPath('/Users/christopherdavis/Documents/GitHub/UCI-Math-9-F22/Week4'),
 PosixPath('/Users/christopherdavis/Documents/GitHub/UCI-Math-9-F22/.git')]
Our iterdir list is showing full paths. If we want to just see the last portion, the file name or the folder name, we can get the name attribute of each of the listed objects. The following list should be the exact same as our os.listdir list from above (possibly in a different order).
(Aside: Notice in the following [x.name for x in p.iterdir()] we are not converting p.iterdir() to a list. A common temptation to new Python programmers would be to instead write [x.name for x in list(p.iterdir())], so that we are iterating through a more familiar object (a list instead of a generator). But there is no reason to make that conversion in this context. If all we want to do is iterate through p.iterdir(), then the generator object is just as good as (or better than) a list. The name itself, with the letters “iter”, is emphasizing that the object produced is good for iterating.)
[x.name for x in p.iterdir()]
['.DS_Store',
 'Week1',
 'LICENSE',
 'images',
 'intro.md',
 '_toc.yml',
 '.gitignore',
 'Week2',
 '_build',
 '_config.yml',
 '.gitattributes',
 'Week4',
 '.git']
The fundamental difference between p.iterdir and os.listdir is that p.iterdir produces PosixPath objects, the same as p was, not strings. (The x.name attributes are probably strings, but the x variables themselves are more useful.) This will make our task of differentiating between files and folders much easier.
[type(x) for x in p.iterdir()]
[pathlib.PosixPath,
 pathlib.PosixPath,
 pathlib.PosixPath,
 pathlib.PosixPath,
 pathlib.PosixPath,
 pathlib.PosixPath,
 pathlib.PosixPath,
 pathlib.PosixPath,
 pathlib.PosixPath,
 pathlib.PosixPath,
 pathlib.PosixPath,
 pathlib.PosixPath,
 pathlib.PosixPath]
The fact that x is a Path instead of a string gives us access to all sorts of extra methods and attributes. Most relevant to our task is the is_file method.
[x.is_file() for x in p.iterdir()]
[True,
 False,
 True,
 False,
 True,
 True,
 True,
 False,
 False,
 True,
 True,
 False,
 False]
If we want a list containing the files (as opposed to the folders), we can use the following. Here we are only keeping the x values that represent files.
[x for x in p.iterdir() if x.is_file()]
[PosixPath('/Users/christopherdavis/Documents/GitHub/UCI-Math-9-F22/.DS_Store'),
 PosixPath('/Users/christopherdavis/Documents/GitHub/UCI-Math-9-F22/LICENSE'),
 PosixPath('/Users/christopherdavis/Documents/GitHub/UCI-Math-9-F22/intro.md'),
 PosixPath('/Users/christopherdavis/Documents/GitHub/UCI-Math-9-F22/_toc.yml'),
 PosixPath('/Users/christopherdavis/Documents/GitHub/UCI-Math-9-F22/.gitignore'),
 PosixPath('/Users/christopherdavis/Documents/GitHub/UCI-Math-9-F22/_config.yml'),
 PosixPath('/Users/christopherdavis/Documents/GitHub/UCI-Math-9-F22/.gitattributes')]
The task itself (finding files) was not the important point in this section. Instead the important point was how using the object-oriented approach, in particular using these specialized Path objects as opposed to plain strings, made the task much easier.
Defining a NamedColor class#
To do object-oriented programming, we need to know how to define our own types of objects. Such custom objects can have whatever methods and attributes we want. Here is an example of defining a NamedColor class; we specify that all objects of this type will have a name attribute and an rgb attribute.
class NamedColor():
    name = "Blue"
    rgb = [0,0,255]
Here is an example of instantiating an object of type NamedColor; we give it the variable name x.
x = NamedColor()
The object x does indeed have the prescribed attributes.
x.name
'Blue'
x.rgb
[0, 0, 255]
So far, NamedColor is a silly class, because objects of this type always represent the same color. To give the class more flexibility, we specify that when an object of class NamedColor is created, two arguments should be passed, and those arguments will specify the name attribute and the rgb attribute.
There is a lot going on in the next example and you shouldn’t expect to internalize it all at once.
Firstly, we are defining a method with the name __init__. This is an example of what is called a “dunder method”, which is short for “double underscore method”. (The letters “init” are surrounded on both sides by two underscores, so there are four underscores total in __init__.) These dunder methods are extremely common in Python, and often have special meanings. We have been using dunder methods all the time, even without realizing it. In the particular case of __init__, this method is called every time a new object is instantiated.
Another confusing aspect of this example, is that all the methods we define will take a variable self as their first input argument. (You could give it another variable name, but it is conventional and least confusing to use self.) This self variable is not explicitly passed by us when we call our methods; Python will do that automatically. This self variable represents the object itself (for example, in the above lines, self would represent the same thing as x). When I was learning object-oriented programming, I found this self argument pretty confusing. For now, I recommend just memorizing that the initial argument to the methods we define in our class definitions is self.
class NamedColor():
    def __init__(self, name, rgb_tuple):
        self.name = name
        self.rgb = rgb_tuple
Now if we try to create an instance of type NamedColor, using the exact same code as we used above, we will get an error about two missing positional arguments. The self argument was passed automatically by Python, but the name and rgb_tuple arguments are missing.
x = NamedColor()
---------------------------------------------------------------------------
TypeError                                 Traceback (most recent call last)
Input In [6], in <cell line: 1>()
----> 1 x = NamedColor()

TypeError: NamedColor.__init__() missing 2 required positional arguments: 'name' and 'rgb_tuple'
Here is a way to instantiate a NamedColor object that matches our current definition. Notice that we can pass "Red", we don’t need to pass it as name="Red"; that is what Python meant above when it referred to name as a positional argument (as opposed to a keyword argument).
x = NamedColor("Red", [255,0,0])
The above line self.rgb = rgb_tuple is what assures that x.rgb has the value we passed. (Usually I would name both sides rgb, but my hope is that having two different names, rgb and rgb_tuple, helps to differentiate their roles.)
x.rgb
[255, 0, 0]
It is pretty inconvenient to have to pass the the numerical RGB values. We will make use of a function to_rgb from Matplotlib’s colors submodule, which can convert string names to RGB triples.
from matplotlib.colors import to_rgb
to_rgb("Red")
(1.0, 0.0, 0.0)
We have been working with RGB triples which are integers between 0 and 255 (inclusive). It’s clear that Matplotlib is using a different normalization (floats between 0 and 1). We will do the conversion between these normalizations ourselves.
Here is a warm-up list comprehension. All it does is turn the tuple (1.0, 0.0, 0.0) into the list [1.0, 0.0, 0.0].
[x for x in to_rgb("Red")]
[1.0, 0.0, 0.0]
One way to convert from floats between 0 and 1 to integers between 0 and 255, is to use the function which sends x to round(x*255) (making use of the built-in round function in Python). Incorporating this into our list comprehension, we see our “usual” RGB triple for red, [255, 0, 0].
[round(x*255) for x in to_rgb("Red")]
[255, 0, 0]
The next big step is to provide a default value of None for the rgb_tuple input argument; this enables the user to leave the rgb_tuple input argument blank when instantiating a NamedColor object. In that case, where rgb_tuple is left blank, we will make use of Matplotlib’s to_rgb function, as above.
class NamedColor():
    def __init__(self, name, rgb_tuple=None):
        if rgb_tuple is None:
            rgb_tuple = [round(x*255) for x in to_rgb(name)]

        self.name = name
        self.rgb = rgb_tuple
Let’s try it out. Notice how in the following example, we pass only one input argument to NamedColor.
z = NamedColor("Orange")
Not surprisingly, the name attribute has been correctly set as "Orange".
z.name
'Orange'
More importantly, the rgb attribute has also been set. This is an indication that our code above is working as desired.
z.rgb
[255, 165, 0]
Let’s add one more method to NamedColor, which will give us a nice way to print our NamedColor objects.
Let’s start with something similar to, but different from, printing. We just evaluate z, our orange NamedColor object, on its own. The string displayed after we evaluate z is not very readable. (About the only helpful thing in the result is that we can see NamedColor appear.) Secretly, when z is evaluated on its own line, another “dunder” method is called, in this case, the dunder method which is called is __repr__. We won’t adjust that method here, but you can if you want to!
z
<__main__.NamedColor at 0x115329570>
Now let’s try printing z. The response is very similar to the previous cell.
print(z)
<__main__.NamedColor object at 0x115329570>
When print(z) is called, the dunder method __str__ on z is called, and the resulting string gets displayed. We are going to redefine that __str__ dunder method here. We will have it return the string we want displayed. Notice that, like usual with object methods, we need to include self as the first argument. We don’t need to include any other arguments.
class NamedColor():
    def __init__(self, name, rgb_tuple=None):
        if rgb_tuple is None:
            rgb_tuple = [round(x*255) for x in to_rgb(name)]

        self.name = name
        self.rgb = rgb_tuple

    def __str__(self):
        return f"The color {self.name} with RGB value {tuple(self.rgb)}"
Let’s try it out. We definitely need to create a new object (changing the definition of the NamedColor class will not affect any existing NamedColor objects).
z = NamedColor("Orange")
Because we have not adjusted the __repr__ dunder method, when we evaluate z on its own, the result is very similar to the results above.
z
<__main__.NamedColor at 0x11532a890>
But now when we evaluate print(z), our custom __str__ dunder method is called, and we see the following informative message.
print(z)
The color Orange with RGB value (255, 165, 0)
Defining the class in a separate file#
In this final section of the course, we will see how to define NamedColor in a separate Python (.py) file, and then how to import the definition into a Jupyter notebook.
Warning. Because we are working in two separate files in this notebook, watching the corresponding video may be less confusing.
An annoying thing when doing this combined programming between external Python files and a Jupyter notebook, is that by default, changes in the external Python file will not be updated in the Jupyter notebook unless you restart the kernel. (Even if you import the file again, that is not enough.) To get around this, we will make use of the following Jupyter magic. The 2 in the second line, %autoreload 2, indicates that every time we run a cell in this Jupyter notebook, Jupyter should check to see if any external files were updated, and re-import them if necessary.
%load_ext autoreload
%autoreload 2
We have restarted the kernel just before executing the above cell. To verify that none of the definitions from the previous section carry over, we try to create a NamedColor object. It is good that this raises an error; our goal here is to move the definition of the NamedColor class to an external file named math9colors.py.
z = NamedColor("Orange")
---------------------------------------------------------------------------
NameError                                 Traceback (most recent call last)
Input In [2], in <cell line: 1>()
----> 1 z = NamedColor("Orange")

NameError: name 'NamedColor' is not defined
Here in the right-hand margin is the starting code for the external file math9colors.py. To make it easier for Python to locate this file, we’ve put it in the same directory as our current Jupyter notebook. The code itself is just the relevant portions from the previous section.
### current contents of the file `math9colors.py`

from matplotlib.colors import to_rgb

class NamedColor():
    def __init__(self, name, rgb_tuple=None):
        if rgb_tuple is None:
            rgb_tuple = [round(x*255) for x in to_rgb(name)]

        self.name = name
        self.rgb = rgb_tuple

    def __str__(self):
        return f"The color {self.name} with RGB value {tuple(self.rgb)}"
We can now import the NamedColor class from the math9colors.py file.
from math9colors import NamedColor
Now the following line, which failed earlier, will work.
z = NamedColor("Orange")
And all the functionality from the previous section should now be present. For example, we can print(z), and the dunder method __str__ that we defined will be used.
print(z)
The color Orange with RGB value (255, 165, 0)
We haven’t done anything too serious with NamedColor yet; it’s hard to see how this class would be useful. Let’s implement something more advanced, so we can use this NamedColor class to set colors in a Pillow image.
As precursors, we import Image from Pillow and import NumPy.
from PIL import Image
import numpy as np
We will eventually use NamedColor to set some colors in an image. Here we import a sample image and get its corresponding NumPy array.
img = Image.open("penguins.jpg")
arr = np.asarray(img)
To set colors in the array, we need a copy which is not read-only.
A = arr.copy()
Recall that z represents one of our NamedColor objects. If we try to set some pixels of A to be this NamedColor object, we get the following error. (The error itself was pretty indecipherable to me when I first saw it. It took more Google searches than usual to understand why this particular error was being raised.)
A[50:100, 100:150] = z
---------------------------------------------------------------------------
TypeError                                 Traceback (most recent call last)
Input In [9], in <cell line: 1>()
----> 1 A[50:100, 100:150] = z

TypeError: int() argument must be a string, a bytes-like object or a real number, not 'NamedColor'
If we try to convert z to a NumPy array, it works without error.
np.array(z)
array(<math9colors.NamedColor object at 0x10ef39e40>, dtype=object)
However, if we try to convert z to a NumPy array with dtype=np.uint8, then we see the exact same error as above. (This dtype was not chosen randomly; it is exactly the dtype that appears when we convert Pillow images to NumPy arrays.)
np.array(z, dtype=np.uint8)
---------------------------------------------------------------------------
TypeError                                 Traceback (most recent call last)
Input In [11], in <cell line: 1>()
----> 1 np.array(z, dtype=np.uint8)

TypeError: int() argument must be a string, a bytes-like object or a real number, not 'NamedColor'
We need to tell Python how our object z can be converted to a NumPy array. We do this, again, with a dunder method, this time the __array__ dunder method. There is only one obvious way to convert a NamedColor object like z to a NumPy array, and that is by using its RGB triple. The code is shown in the right-hand margin.
### current contents of the file `math9colors.py`

from matplotlib.colors import to_rgb

class NamedColor():
    def __init__(self, name, rgb_tuple=None):
        if rgb_tuple is None:
            rgb_tuple = [round(x*255) for x in to_rgb(name)]

        self.name = name
        self.rgb = rgb_tuple

    def __str__(self):
        return f"The color {self.name} with RGB value {tuple(self.rgb)}"

    def __array__(self, dtype=None):
        return np.array(self.rgb, dtype=dtype)
A good sign is that a new error shows up, and this one is easy to fix. Even though we have imported NumPy in this Jupyter notebook, we need to import it in the math9colors.py file, so that the code np.array makes sense.
A[50:100, 100:150] = z
---------------------------------------------------------------------------
NameError                                 Traceback (most recent call last)
Input In [12], in <cell line: 1>()
----> 1 A[50:100, 100:150] = z

File ~/Dropbox/Teaching/DTEI/jupyter-notebooks/Week4/math9colors.py:15, in NamedColor.__array__(self, dtype)
     14 def __array__(self, dtype=None):
---> 15     return np.array(self.rgb, dtype=dtype)

NameError: name 'np' is not defined
We now include the NumPy import. The final file contents is shown below.
### Final version of the file `math9colors.py`

from matplotlib.colors import to_rgb
import numpy as np

class NamedColor():
    def __init__(self, name, rgb_tuple=None):
        if rgb_tuple is None:
            rgb_tuple = [round(x*255) for x in to_rgb(name)]

        self.name = name
        self.rgb = rgb_tuple

    def __str__(self):
        return f"The color {self.name} with RGB value {tuple(self.rgb)}"

    def __array__(self, dtype=None):
        return np.array(self.rgb, dtype=dtype)
The line above which raised an error now works.
A[50:100, 100:150] = z
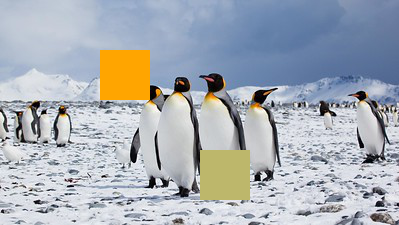
Before we display the image, we set some more pixels. We expect to see an orange square, and below it, a “dark khaki” square. (Any web color will work, because all web colors are allowed in Matplotlib’s to_rgb function.)
A[150:200, 200:250] = NamedColor("darkkhaki")
Here is the resulting image. It is worth emphasizing that something like A[150:200, 200:250] = "darkkhaki" would never work; it is essential that we are using our custom NamedColor class.
Image.fromarray(A)
Congratulations on making it to the end of the Python portion of Math 9! Thank you for these last four weeks, and good luck with whatever programming material you learn next.