
Week 8 Friday#
import pandas as pd
import altair as alt
from matplotlib import pyplot as plt
df = pd.DataFrame([
    [1,9,0],
    [8,9,2],
    [7,6,7],
    [11,6,4],
    [9,-3,1]
], columns=["x1", "x2", "y"])
base = alt.Chart(df).encode(
    x="x1",
    y="x2",
)

points = base.mark_circle()
labels = base.mark_text(dx=10).encode(
    text="y"
)

points+labels
from sklearn.tree import DecisionTreeRegressor
tree = DecisionTreeRegressor()
type(tree)
sklearn.tree._classes.DecisionTreeRegressor
tree.fit(df[["x1", "x2"]], df["y"])
DecisionTreeRegressor()In a Jupyter environment, please rerun this cell to show the HTML representation or trust the notebook.
On GitHub, the HTML representation is unable to render, please try loading this page with nbviewer.org.
DecisionTreeRegressor()
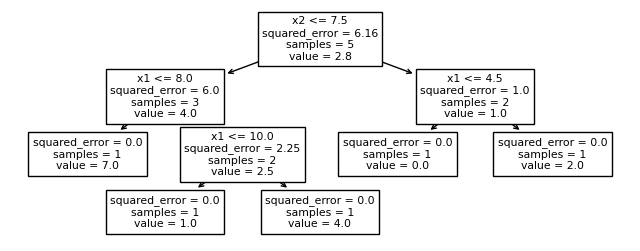
from sklearn.tree import plot_tree
fig = plt.figure(figsize=(8,3))
_ = plot_tree(tree,
                   feature_names=tree.feature_names_in_,
                   filled=False)

import numpy as np
rng = np.random.default_rng()
arr = rng.random(size=(5000,2))
arr[:, 0] *= 12
arr[:, 1] = 15*arr[:, 1] - 5
df_grid = pd.DataFrame(arr, columns=["x1", "x2"])
df_grid["pred"] = tree.predict(df_grid[["x1", "x2"]])
alt.Chart(df_grid).mark_circle().encode(
    x="x1",
    y="x2",
    color="pred:N"
)
Two “manual” ways to control overfitting of decision trees in scikit-learn.
fig = plt.figure(figsize=(8,3))
_ = plot_tree(tree,
                   feature_names=tree.feature_names_in_,
                   filled=False)
 Created in Deepnote