Monday Worksheet
From Jupyter notebook to Streamlit app
Here is the code from class on Friday, except that it has been merged together into a Streamlit app, and some minor customizations have been made to the Altair charts.
import streamlit as st
import numpy as np
import pandas as pd
import altair as alt
from sklearn.linear_model import LinearRegression

rng = np.random.default_rng()

st.title("Over-fitting")

m = 50
x = 10*rng.random(size=50) - 5
c = [3.2,6.5,-1.4]

y_true = c[0] + c[1]*x + c[2]*x**2

y = y_true + rng.normal(loc = 0, scale = 30, size = m)

df = pd.DataFrame({"x":x,"y_true":y_true, "y": y})


chart_data = alt.Chart(df).mark_circle(clip = True).encode(
    x = "x",
    y = "y"
)

chart_true = alt.Chart(df).mark_line().encode(
    x = "x",
    y = "y_true",
    color = alt.value("black"),
)

for i in range(1,21):
    df["x"+str(i)] = df["x"]**i

def poly_reg(df, d):
    reg = LinearRegression()
    X = df[[f"x{i}" for i in range(1,d+1)]]
    reg.fit(X,df["y"])
    return reg

def make_chart(df,d):
    df2 = df.copy()
    reg = poly_reg(df,d)
    X = df[[f"x{i}" for i in range(1,d+1)]]
    df2["y_pred"] = reg.predict(X)
    chart = alt.Chart(df2).mark_line(clip = True).encode(
        x = "x1",
        y = alt.Y("y_pred", scale = alt.Scale(domain=(-100,100))),
        color = alt.value("red"),
    )
    return chart

st.altair_chart(make_chart(df,2)+chart_data+chart_true)
Exercise
Paste the code into a
pyfile and compile the resulting Streamlit app usingstreamlit run <filename>from a terminal.The code
[f"x{i}" for i in range(1,d+1)]appears twice, which is not very DRY (for example, if we later wanted to make it x^i, it would be annoying to have to change it multiple places). Write a short function which takes as inputdand as output returns the list[x1, x2, ..., xd]. Use that function to replace both appearances.Also use that function to rewrite the portion
df["x"+str(i)]from the for-loop.
Exercise
In the current version of the app, the fit polynomial always has degree 2. Put in a slider, so that the fit polynomial can have any integer degree between 1 and 20.
Copy the method from this example to include a title at the top of your Altair chart, showing the degree of the polynomial.
Notice how the data changes every time the slider is moved. Make the data consistent by using
st.session_state. (If you’re getting strange errors involvingst.session_state, try refreshing the Streamlit app in your web browser.)
Exercise
In the make_chart code, we are drawing the fit polynomial using the original \(m\) data points. There is no reason to use those. Instead use a new DataFrame where the x1 column is given by 500 evenly spaced values between -5 and 5, where columns x2, …, xd are given by the appropriate powers of the x1 column, and where y_pred is computed from those d columns, as before.
Submission
Upload the .py file to Canvas before 5pm on Tuesday. As always with the worksheets, this is graded on effort, not on correctness, so it’s fine if you do not finish.
Miscellaneous practice exercises
Here are a few more practice exercises for the midterm. You do not need to submit anything from this portion of the worksheet.
my_list = []
for i in range(3,99,3):
    if i < 50:
        my_list.append(i)
    else:
        my_list.append(100)
Exercise
Define my_list from the above code using list comprehension instead of a for loop.
Exercise
Using NumPy (and maybe pandas, but no for-loops), estimate the probability that if you choose 5 random integers between 0 and 10 (inclusive), the maximum will be 7 or 8.
Exercise
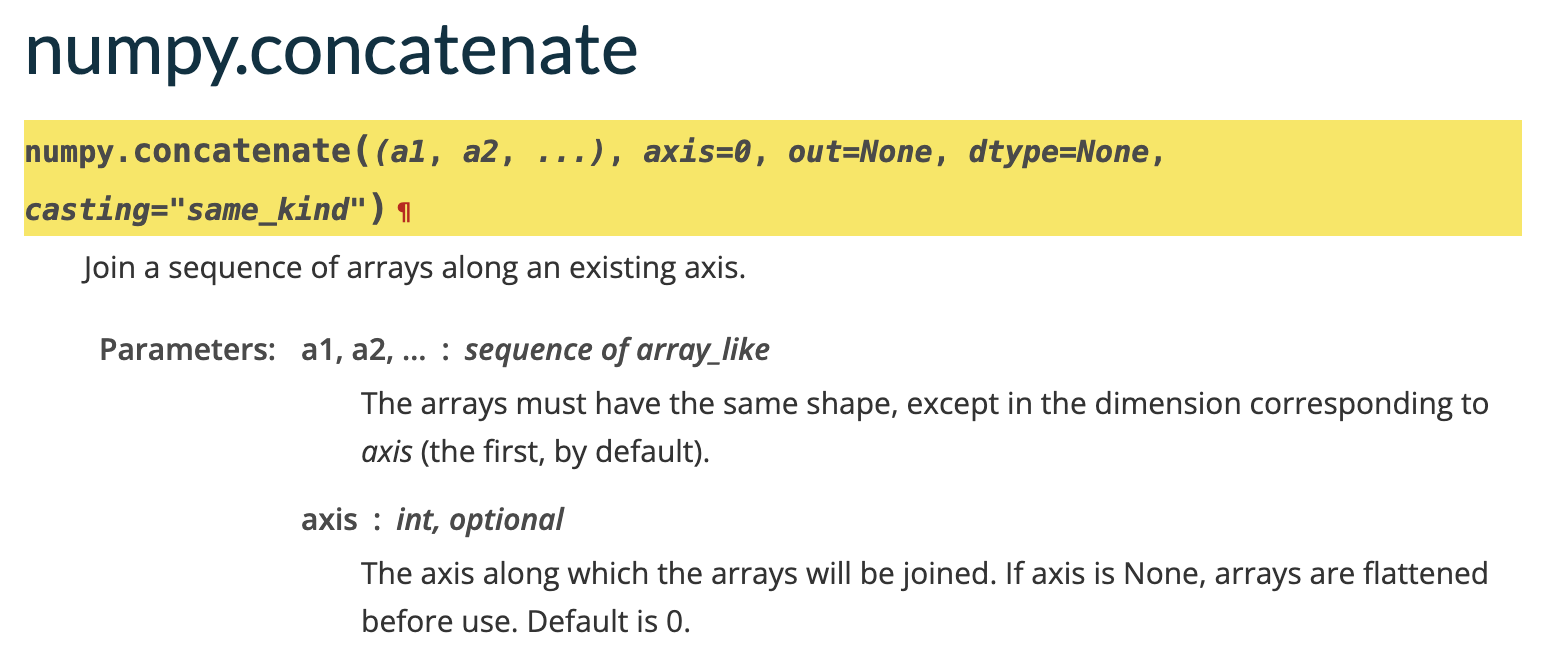
Here is documentation for the function np.concatenate:
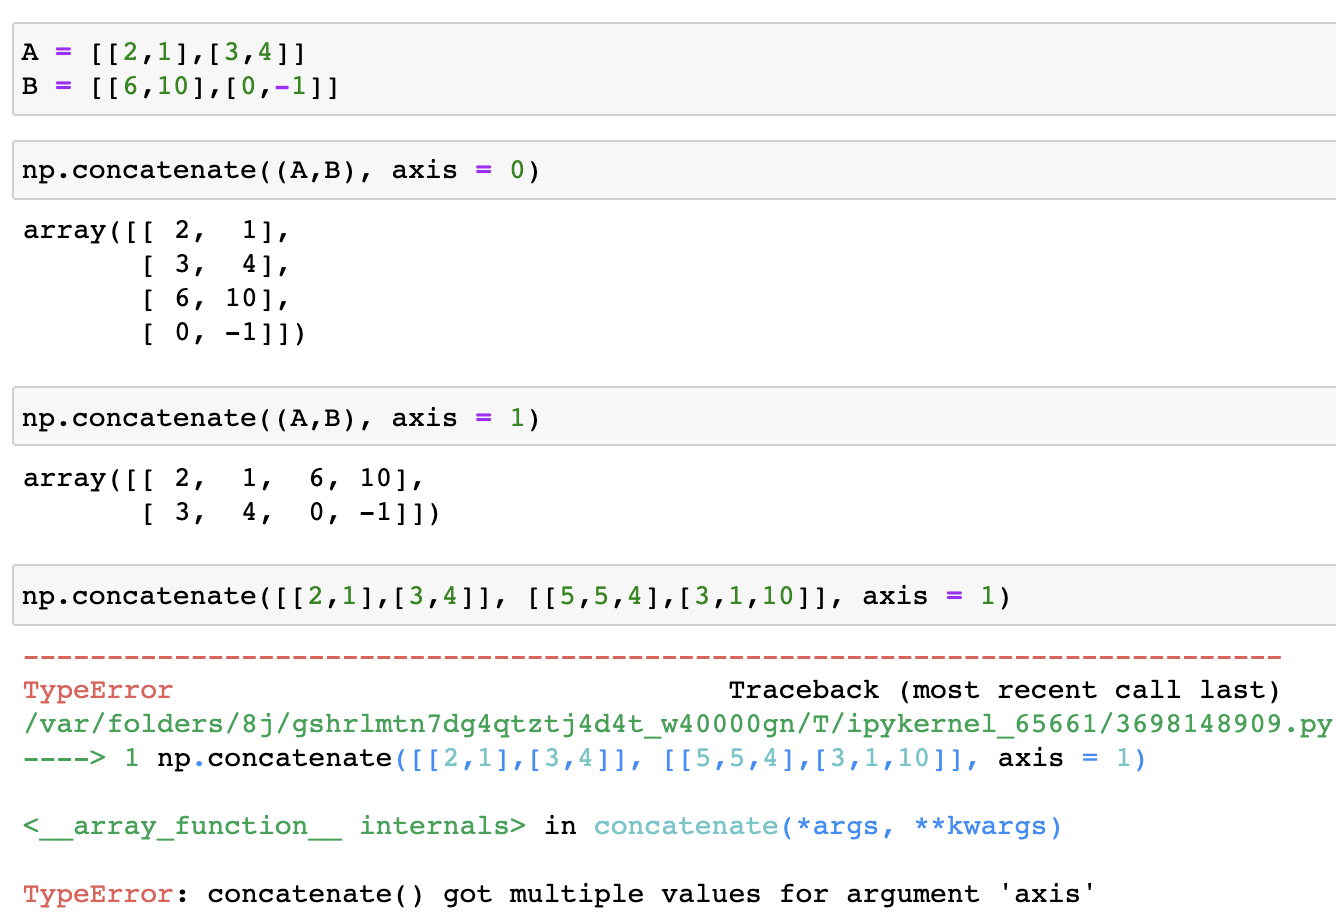
 What is the cause of the following error?

Exercise
In lecture on Friday I got confused because I wanted to evaluate the polynomial using something like reg.predict([[3]]), whereas I really needed to evaluate with all of the powers, like reg.predict([[3,9,27,81,243]]). Write a function eval_poly(reg, x) which takes as input the fit LinearRegression object reg and a number x, and as output returns the value of the polynomial. (Hint. You can get the degree of the polynomial from reg using the attribute n_features_in_. Here is a reference page, although that reference page doesn’t have much detail other than to say that this attribute exists. I didn’t find it using the reference page; I found it by typing reg. and then hitting tab.)
