
Week 5 Videos
Contents
Week 5 Videos
Unpacking
Warm-up task: Define
ncolto be the number of columns in the Spotify dataset.
import pandas as pd
df = pd.read_csv("../data/spotify_dataset.csv", na_values=" ").dropna()
t = df.shape
t[1]
23
_, ncol = df.shape
ncol
23
_
1545
import matplotlib.pyplot as plt
t = plt.subplots()

type(t)
tuple
type(t[0])
matplotlib.figure.Figure
type(t[1])
matplotlib.axes._subplots.AxesSubplot
# tuple unpacking
fig, ax = plt.subplots()
type(fig)
matplotlib.figure.Figure
type(ax)
matplotlib.axes._subplots.AxesSubplot
for a,b in df.groupby("Artist"):
    print(a)
    display(b)
    break
*NSYNC
| Index | Highest Charting Position | Number of Times Charted | Week of Highest Charting | Song Name | Streams | Artist | Artist Followers | Song ID | Genre | ... | Danceability | Energy | Loudness | Speechiness | Acousticness | Liveness | Tempo | Duration (ms) | Valence | Chord | |
|---|---|---|---|---|---|---|---|---|---|---|---|---|---|---|---|---|---|---|---|---|---|
| 690 | 691 | 184 | 1 | 2020-12-18--2020-12-25 | Merry Christmas, Happy Holidays | 6,635,128 | *NSYNC | 1564750.0 | 4v9WbaxW8HdjqfUiWYWsII | ['boy band', 'dance pop', 'pop', 'post-teen pop'] | ... | 0.643 | 0.939 | -3.967 | 0.0463 | 0.104 | 0.881 | 104.999 | 255307.0 | 0.756 | F |
1 rows × 23 columns
Generating data for linear regression
from sklearn.datasets import make_regression
help(make_regression)
Help on function make_regression in module sklearn.datasets._samples_generator:

make_regression(n_samples=100, n_features=100, *, n_informative=10, n_targets=1, bias=0.0, effective_rank=None, tail_strength=0.5, noise=0.0, shuffle=True, coef=False, random_state=None)
    Generate a random regression problem.

    The input set can either be well conditioned (by default) or have a low
    rank-fat tail singular profile. See :func:`make_low_rank_matrix` for
    more details.

    The output is generated by applying a (potentially biased) random linear
    regression model with `n_informative` nonzero regressors to the previously
    generated input and some gaussian centered noise with some adjustable
    scale.

    Read more in the :ref:`User Guide <sample_generators>`.

    Parameters
    ----------
    n_samples : int, default=100
        The number of samples.

    n_features : int, default=100
        The number of features.

    n_informative : int, default=10
        The number of informative features, i.e., the number of features used
        to build the linear model used to generate the output.

    n_targets : int, default=1
        The number of regression targets, i.e., the dimension of the y output
        vector associated with a sample. By default, the output is a scalar.

    bias : float, default=0.0
        The bias term in the underlying linear model.

    effective_rank : int, default=None
        if not None:
            The approximate number of singular vectors required to explain most
            of the input data by linear combinations. Using this kind of
            singular spectrum in the input allows the generator to reproduce
            the correlations often observed in practice.
        if None:
            The input set is well conditioned, centered and gaussian with
            unit variance.

    tail_strength : float, default=0.5
        The relative importance of the fat noisy tail of the singular values
        profile if `effective_rank` is not None. When a float, it should be
        between 0 and 1.

    noise : float, default=0.0
        The standard deviation of the gaussian noise applied to the output.

    shuffle : bool, default=True
        Shuffle the samples and the features.

    coef : bool, default=False
        If True, the coefficients of the underlying linear model are returned.

    random_state : int, RandomState instance or None, default=None
        Determines random number generation for dataset creation. Pass an int
        for reproducible output across multiple function calls.
        See :term:`Glossary <random_state>`.

    Returns
    -------
    X : ndarray of shape (n_samples, n_features)
        The input samples.

    y : ndarray of shape (n_samples,) or (n_samples, n_targets)
        The output values.

    coef : ndarray of shape (n_features,) or (n_features, n_targets)
        The coefficient of the underlying linear model. It is returned only if
        coef is True.
t = make_regression(n_features=1)
type(t)
tuple
len(t)
2
type(t[0])
numpy.ndarray
t[0].shape
(100, 1)
type(t[1])
numpy.ndarray
t[1].shape
(100,)
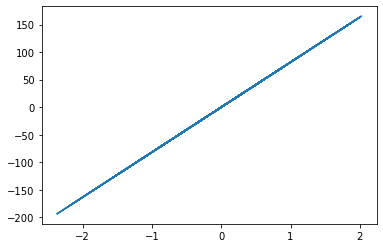
fig, ax = plt.subplots()
ax.plot(t[0], t[1])
[<matplotlib.lines.Line2D at 0x7f8e59a4eb10>]
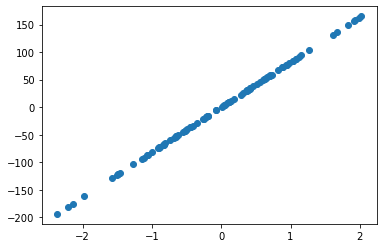
fig, ax = plt.subplots()
ax.scatter(t[0], t[1])
<matplotlib.collections.PathCollection at 0x7f8e59a8d610>
X,y = make_regression(n_samples = 10, n_features=1, coef=True)
---------------------------------------------------------------------------
ValueError                                Traceback (most recent call last)
/var/folders/8j/gshrlmtn7dg4qtztj4d4t_w40000gn/T/ipykernel_90918/737216033.py in <module>
----> 1 X,y = make_regression(n_samples = 10, n_features=1, coef=True)

ValueError: too many values to unpack (expected 2)
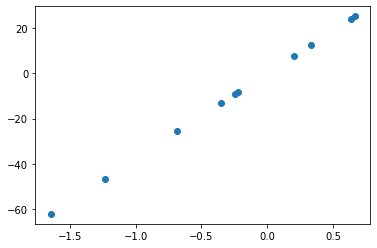
X,y,m = make_regression(n_samples = 10, n_features=1, coef=True)
m
array(37.61300837)
fig, ax = plt.subplots()
ax.scatter(X,y)
<matplotlib.collections.PathCollection at 0x7f8e59a8d590>
Linear regression using scikit-learn
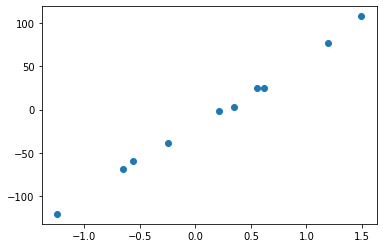
X,y,m = make_regression(n_samples = 10, n_features=1, coef=True, noise=5, bias=-17.4)
fig, ax = plt.subplots()
ax.scatter(X,y)
<matplotlib.collections.PathCollection at 0x7f8e4b0f75d0>
from sklearn.linear_model import LinearRegression
reg = LinearRegression()
type(reg)
sklearn.linear_model._base.LinearRegression
reg.fit(X,y)
LinearRegression()
reg.coef_
array([80.74305618])
m
array(80.45838668)
reg.intercept_
-18.956015204674802
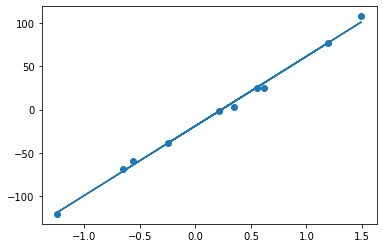
pred = reg.predict(X)
pred
array([ -64.36020915,  -71.53057174,   77.7462882 ,  -38.87491328,
          9.15078824,   -1.67347246,  101.57870959,   26.11546954,
       -119.41690634,   30.87178162])
fig, ax = plt.subplots()
ax.scatter(X,y)
ax.plot(X,pred)
[<matplotlib.lines.Line2D at 0x7f8e4b37aa50>]
Linear regression with a real dataset
Find the line of best fit for “Acousticness” vs “Energy” from the Spotify dataset.
df = pd.read_csv("../data/spotify_dataset.csv", na_values=" ").dropna()
import altair as alt
alt.Chart(df).mark_circle().encode(
    x="Acousticness",
    y="Energy"
)
reg = LinearRegression()
reg.fit(df["Acousticness"],df["Energy"])
---------------------------------------------------------------------------
ValueError                                Traceback (most recent call last)
/var/folders/8j/gshrlmtn7dg4qtztj4d4t_w40000gn/T/ipykernel_90918/2831094536.py in <module>
----> 1 reg.fit(df["Acousticness"],df["Energy"])

~/miniconda3/envs/math10s22/lib/python3.7/site-packages/sklearn/linear_model/_base.py in fit(self, X, y, sample_weight)
    661
    662         X, y = self._validate_data(
--> 663             X, y, accept_sparse=accept_sparse, y_numeric=True, multi_output=True
    664         )
    665

~/miniconda3/envs/math10s22/lib/python3.7/site-packages/sklearn/base.py in _validate_data(self, X, y, reset, validate_separately, **check_params)
    579                 y = check_array(y, **check_y_params)
    580             else:
--> 581                 X, y = check_X_y(X, y, **check_params)
    582             out = X, y
    583

~/miniconda3/envs/math10s22/lib/python3.7/site-packages/sklearn/utils/validation.py in check_X_y(X, y, accept_sparse, accept_large_sparse, dtype, order, copy, force_all_finite, ensure_2d, allow_nd, multi_output, ensure_min_samples, ensure_min_features, y_numeric, estimator)
    974         ensure_min_samples=ensure_min_samples,
    975         ensure_min_features=ensure_min_features,
--> 976         estimator=estimator,
    977     )
    978

~/miniconda3/envs/math10s22/lib/python3.7/site-packages/sklearn/utils/validation.py in check_array(array, accept_sparse, accept_large_sparse, dtype, order, copy, force_all_finite, ensure_2d, allow_nd, ensure_min_samples, ensure_min_features, estimator)
    771                     "Reshape your data either using array.reshape(-1, 1) if "
    772                     "your data has a single feature or array.reshape(1, -1) "
--> 773                     "if it contains a single sample.".format(array)
    774                 )
    775

ValueError: Expected 2D array, got 1D array instead:
array=[0.127  0.0383 0.335  ... 0.184  0.249  0.433 ].
Reshape your data either using array.reshape(-1, 1) if your data has a single feature or array.reshape(1, -1) if it contains a single sample.
df["Acousticness"]
0       0.12700
1       0.03830
2       0.33500
3       0.04690
4       0.02030
         ...
1551    0.00261
1552    0.24000
1553    0.18400
1554    0.24900
1555    0.43300
Name: Acousticness, Length: 1545, dtype: float64
df[["Acousticness"]]
| Acousticness | |
|---|---|
| 0 | 0.12700 |
| 1 | 0.03830 |
| 2 | 0.33500 |
| 3 | 0.04690 |
| 4 | 0.02030 |
| ... | ... |
| 1551 | 0.00261 |
| 1552 | 0.24000 |
| 1553 | 0.18400 |
| 1554 | 0.24900 |
| 1555 | 0.43300 |
1545 rows × 1 columns
reg.fit(df[["Acousticness"]],df["Energy"])
LinearRegression()
reg.intercept_
0.7205632317364903
reg.coef_
array([-0.35010056])
Predict \(y = -0.35\cdot x + 0.72\).