
Week 7 Videos
Contents
Week 7 Videos#
Linear data with an outlier#
import numpy as np
import matplotlib.pyplot as plt
rng = np.random.default_rng()
type(rng)
numpy.random._generator.Generator
rng.random(5)
array([0.71766176, 0.67084367, 0.3629894 , 0.63571399, 0.2977128 ])
30*rng.random(5) - 20
array([ -4.40385734,  -6.41524188,   1.36656718, -19.49290652,
        -0.85800345])
m,b = 30*rng.random(2) - 20
x = np.arange(0, 10, 0.5)
x
array([0. , 0.5, 1. , 1.5, 2. , 2.5, 3. , 3.5, 4. , 4.5, 5. , 5.5, 6. ,
       6.5, 7. , 7.5, 8. , 8.5, 9. , 9.5])
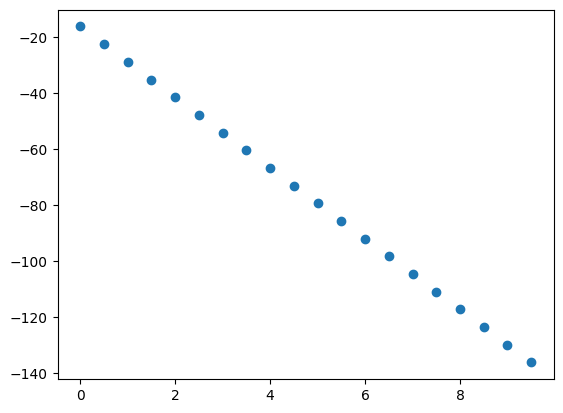
y = m*x+b
fig, ax = plt.subplots()
ax.scatter(x, y)
<matplotlib.collections.PathCollection at 0x7fa719099a60>
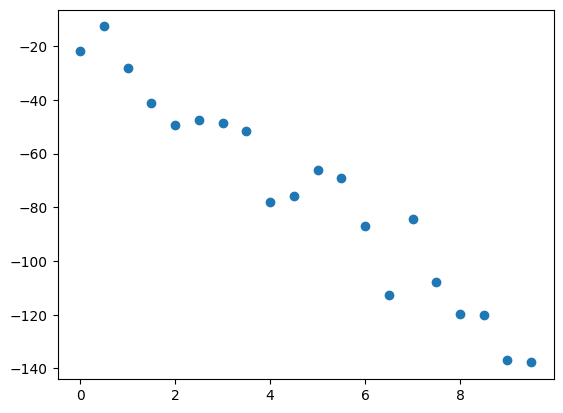
noise = rng.normal(loc=0, scale=10, size=y.shape)
y2 = y+noise
fig, ax = plt.subplots()
ax.scatter(x, y2)
<matplotlib.collections.PathCollection at 0x7fa735291b20>
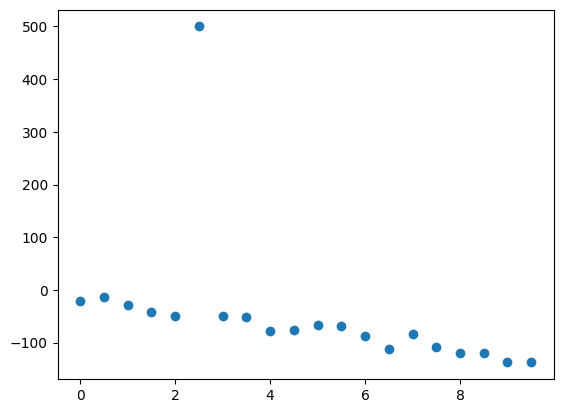
y2[5] = 500
fig, ax = plt.subplots()
ax.scatter(x, y2)
<matplotlib.collections.PathCollection at 0x7fa7359da3a0>
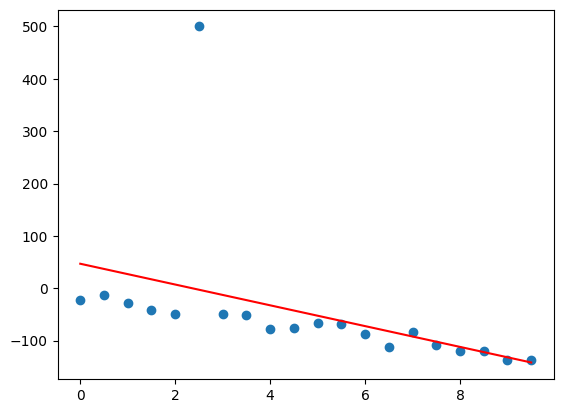
Line of best fit using Mean Squared Error#
from sklearn.linear_model import LinearRegression
reg = LinearRegression()
x.shape
(20,)
X = x.reshape(-1,1)
reg.fit(X, y2)
LinearRegression()In a Jupyter environment, please rerun this cell to show the HTML representation or trust the notebook.
On GitHub, the HTML representation is unable to render, please try loading this page with nbviewer.org.
LinearRegression()
ypred = reg.predict(X)
fig, ax = plt.subplots()
ax.scatter(x, y2)
ax.plot(x, ypred, 'r')
[<matplotlib.lines.Line2D at 0x7fa717972460>]
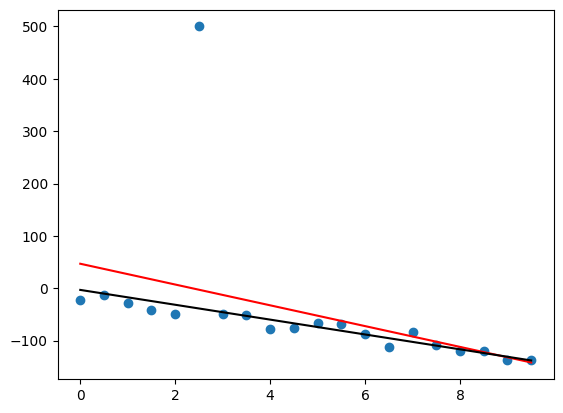
Line of best fit using Mean Absolute Error#
Reference: Stack Overflow
from sklearn.linear_model import SGDRegressor
sgdreg = SGDRegressor(loss="epsilon_insensitive", epsilon=0)
sgdreg.fit(X, y2)
SGDRegressor(epsilon=0, loss='epsilon_insensitive')In a Jupyter environment, please rerun this cell to show the HTML representation or trust the notebook.
On GitHub, the HTML representation is unable to render, please try loading this page with nbviewer.org.
SGDRegressor(epsilon=0, loss='epsilon_insensitive')
ypred2 = sgdreg.predict(X)
fig, ax = plt.subplots()
ax.scatter(x, y2)
ax.plot(x, ypred, 'r')
ax.plot(x, ypred2, 'k')
[<matplotlib.lines.Line2D at 0x7fa7018b3130>]
Computing Mean Squared Error and Mean Absolute Error in scikit-learn#
from sklearn.metrics import mean_absolute_error, mean_squared_error
mean_squared_error(y2, ypred)
13823.74709827255
mean_squared_error(y2, ypred2)
14622.352062657656
mean_absolute_error(y2, ypred)
51.65405629230766
mean_absolute_error(y2, ypred2)
35.41119321144292
((y2-ypred)**2).mean()
13823.74709827255
((y2-ypred)**2).sum()/len(y2)
13823.74709827255
(abs(y2-ypred)).mean()
51.65405629230766
 Created in Deepnote