
Week 9 Videos
Contents
Week 9 Videos#
import numpy as np
import pandas as pd
import altair as alt
Using PolynomialFeatures for polynomial regression#
Find the best degree 10 polynomial fit to the following data.
df_full = pd.read_csv("sim_data.csv")
c = alt.Chart(df_full).mark_circle().encode(
    x="x",
    y=alt.Y("y", scale=alt.Scale(domain=(-100,200)))
)

c
from sklearn.preprocessing import PolynomialFeatures
from sklearn.linear_model import LinearRegression
poly = PolynomialFeatures(degree=3)
poly.fit([1,2,3])
---------------------------------------------------------------------------
ValueError                                Traceback (most recent call last)
/tmp/ipykernel_1082/2187196076.py in <module>
----> 1 poly.fit([1,2,3])

/shared-libs/python3.7/py/lib/python3.7/site-packages/sklearn/preprocessing/_polynomial.py in fit(self, X, y)
    285             Fitted transformer.
    286         """
--> 287         _, n_features = self._validate_data(X, accept_sparse=True).shape
    288
    289         if isinstance(self.degree, numbers.Integral):

/shared-libs/python3.7/py/lib/python3.7/site-packages/sklearn/base.py in _validate_data(self, X, y, reset, validate_separately, **check_params)
    564             raise ValueError("Validation should be done on X, y or both.")
    565         elif not no_val_X and no_val_y:
--> 566             X = check_array(X, **check_params)
    567             out = X
    568         elif no_val_X and not no_val_y:

/shared-libs/python3.7/py/lib/python3.7/site-packages/sklearn/utils/validation.py in check_array(array, accept_sparse, accept_large_sparse, dtype, order, copy, force_all_finite, ensure_2d, allow_nd, ensure_min_samples, ensure_min_features, estimator)
    771                     "Reshape your data either using array.reshape(-1, 1) if "
    772                     "your data has a single feature or array.reshape(1, -1) "
--> 773                     "if it contains a single sample.".format(array)
    774                 )
    775

ValueError: Expected 2D array, got 1D array instead:
array=[1 2 3].
Reshape your data either using array.reshape(-1, 1) if your data has a single feature or array.reshape(1, -1) if it contains a single sample.
poly.fit([[1],[2],[3]])
PolynomialFeatures(degree=3)
poly.transform([[1],[2],[3]])
array([[ 1.,  1.,  1.,  1.],
       [ 1.,  2.,  4.,  8.],
       [ 1.,  3.,  9., 27.]])
poly = PolynomialFeatures(degree=10, include_bias=False)
poly.fit(df_full[["x"]])
PolynomialFeatures(degree=10, include_bias=False)
poly_output = poly.transform(df_full[["x"]])
poly_output.shape
(1000, 10)
df_full.shape
(1000, 2)
reg = LinearRegression()
reg.fit(poly_output, df_full["y"])
LinearRegression()
df_full["y_pred"] = reg.predict(poly_output)
c1 = alt.Chart(df_full).mark_line(color="red").encode(
    x="x",
    y=alt.Y("y_pred", scale=alt.Scale(domain=(-100,200)))
)

c+c1
reg.coef_
array([ 1.93921635e+00,  6.63730004e-01,  4.19627174e-01,  1.05234312e-01,
       -2.52265950e-02, -3.66440336e-03,  5.56502040e-04,  5.11511273e-05,
       -4.08015016e-06, -2.40595561e-07])
Simplifying the workflow using Pipeline#
from sklearn.pipeline import Pipeline
pipe = Pipeline(
    [
        ("poly", PolynomialFeatures(degree=10, include_bias=False)),
        ("reg" , LinearRegression())
    ]
)
pipe.fit(df_full[["x"]], df_full["y"])
Pipeline(steps=[('poly', PolynomialFeatures(degree=10, include_bias=False)),
                ('reg', LinearRegression())])
pipe.predict(df_full[["x"]])[:10]
array([-16.61185077,  48.44066523,  48.35605204, -12.05378022,
       -23.57571082,  49.62925485,   8.4672055 ,  20.5486394 ,
        68.87074109,   4.69566674])
Evidence of overfitting 1#
results = []

for i in range(8):
    df = df_full.sample(50, random_state=i)
    pipe.fit(df[["x"]], df["y"])
    df_plot = pd.DataFrame({"x": np.arange(-8,8,0.1)})
    df_plot["y_pred"] = pipe.predict(df_plot[["x"]])
    df_plot["random_state"] = i
    results.append(df_plot)
results[3]
| x | y_pred | random_state | |
|---|---|---|---|
| 0 | -8.0 | 154.784602 | 3 |
| 1 | -7.9 | 114.177796 | 3 |
| 2 | -7.8 | 82.397125 | 3 |
| 3 | -7.7 | 57.952573 | 3 |
| 4 | -7.6 | 39.551362 | 3 |
| ... | ... | ... | ... |
| 155 | 7.5 | 120.290365 | 3 |
| 156 | 7.6 | 119.430406 | 3 |
| 157 | 7.7 | 118.994307 | 3 |
| 158 | 7.8 | 119.416480 | 3 |
| 159 | 7.9 | 121.238325 | 3 |
160 rows × 3 columns
df_plot2 = pd.concat(results, axis=0)
c1 = alt.Chart(df_plot2).mark_line().encode(
    x="x",
    y=alt.Y("y_pred", scale=alt.Scale(domain=(-100,200))),
    color="random_state:N"
)

c+c1
Evidence of overfitting 2#
from sklearn.metrics import mean_squared_error
from sklearn.model_selection import train_test_split
X_train, X_test, y_train, y_test = train_test_split(df_full[["x"]], df_full["y"], random_state=0, train_size=50)

train_error = []
test_error = []

for d in range(1,30):
    pipe = Pipeline(
        [
            ("poly", PolynomialFeatures(degree=d, include_bias=False)),
            ("reg" , LinearRegression())
        ]
    )
    pipe.fit(X_train, y_train)
    train_error.append(mean_squared_error(y_train, pipe.predict(X_train)))
    test_error.append(mean_squared_error(y_test, pipe.predict(X_test)))
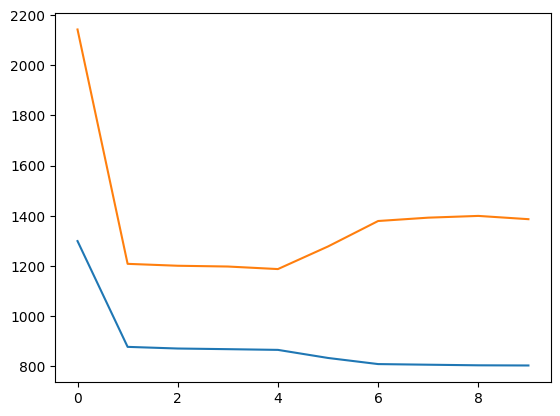
train_error[:5]
[1298.9412892405774,
 877.1041647747753,
 870.5283022206671,
 867.9213135311684,
 865.1010263394086]
test_error[:5]
[2142.5158992895012,
 1208.1193683613008,
 1200.5113425429654,
 1197.4353815725306,
 1187.2768345993675]
from matplotlib import pyplot as plt
fig, ax = plt.subplots()
ax.plot(train_error[:10])
ax.plot(test_error[:10])
[<matplotlib.lines.Line2D at 0x7f016db32910>]
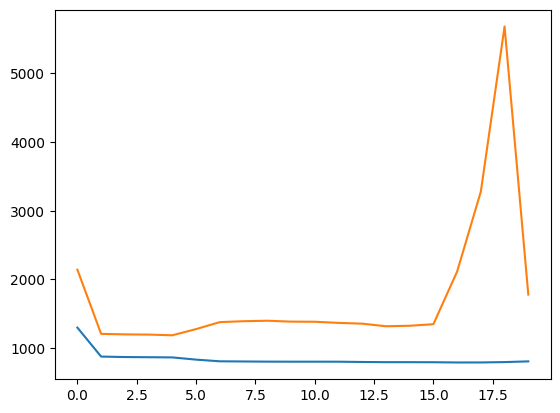
fig, ax = plt.subplots()
ax.plot(train_error[:20])
ax.plot(test_error[:20])
[<matplotlib.lines.Line2D at 0x7f0167c87f90>]
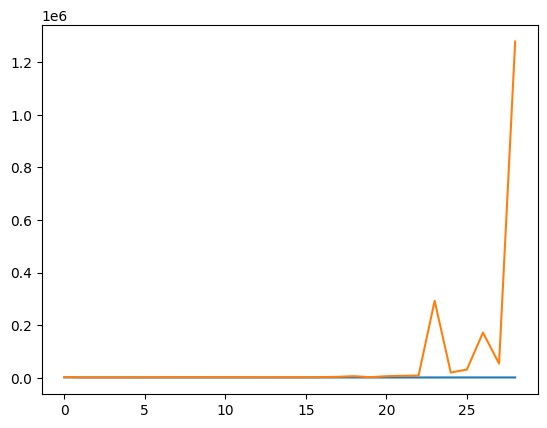
fig, ax = plt.subplots()
ax.plot(train_error)
ax.plot(test_error)
[<matplotlib.lines.Line2D at 0x7f0164450390>]
 Created in Deepnote