
Week 6 Videos
Contents
Week 6 Videos#
Artificial data for linear regression#
import pandas as pd
import altair as alt
from sklearn.datasets import make_regression
help(make_regression)
Help on function make_regression in module sklearn.datasets._samples_generator:

make_regression(n_samples=100, n_features=100, *, n_informative=10, n_targets=1, bias=0.0, effective_rank=None, tail_strength=0.5, noise=0.0, shuffle=True, coef=False, random_state=None)
    Generate a random regression problem.

    The input set can either be well conditioned (by default) or have a low
    rank-fat tail singular profile. See :func:`make_low_rank_matrix` for
    more details.

    The output is generated by applying a (potentially biased) random linear
    regression model with `n_informative` nonzero regressors to the previously
    generated input and some gaussian centered noise with some adjustable
    scale.

    Read more in the :ref:`User Guide <sample_generators>`.

    Parameters
    ----------
    n_samples : int, default=100
        The number of samples.

    n_features : int, default=100
        The number of features.

    n_informative : int, default=10
        The number of informative features, i.e., the number of features used
        to build the linear model used to generate the output.

    n_targets : int, default=1
        The number of regression targets, i.e., the dimension of the y output
        vector associated with a sample. By default, the output is a scalar.

    bias : float, default=0.0
        The bias term in the underlying linear model.

    effective_rank : int, default=None
        If not None:
            The approximate number of singular vectors required to explain most
            of the input data by linear combinations. Using this kind of
            singular spectrum in the input allows the generator to reproduce
            the correlations often observed in practice.
        If None:
            The input set is well conditioned, centered and gaussian with
            unit variance.

    tail_strength : float, default=0.5
        The relative importance of the fat noisy tail of the singular values
        profile if `effective_rank` is not None. When a float, it should be
        between 0 and 1.

    noise : float, default=0.0
        The standard deviation of the gaussian noise applied to the output.

    shuffle : bool, default=True
        Shuffle the samples and the features.

    coef : bool, default=False
        If True, the coefficients of the underlying linear model are returned.

    random_state : int, RandomState instance or None, default=None
        Determines random number generation for dataset creation. Pass an int
        for reproducible output across multiple function calls.
        See :term:`Glossary <random_state>`.

    Returns
    -------
    X : ndarray of shape (n_samples, n_features)
        The input samples.

    y : ndarray of shape (n_samples,) or (n_samples, n_targets)
        The output values.

    coef : ndarray of shape (n_features,) or (n_features, n_targets)
        The coefficient of the underlying linear model. It is returned only if
        coef is True.
make_regression(n_samples=4, n_features=2)
(array([[ 1.44089066, -2.55372173],
        [ 0.65938893,  0.91995171],
        [-1.82165048, -0.80337151],
        [ 0.03900098, -0.45748574]]),
 array([-88.39997798,  32.6088018 , -29.28375752, -15.97838099]))
X, y = make_regression(n_samples=50, n_features=1)
X
array([[-0.15025868],
       [-0.42176296],
       [-0.29864099],
       [ 0.32309439],
       [ 0.90403753],
       [-0.24620504],
       [ 0.44303931],
       [-0.45439768],
       [ 0.93924799],
       [ 1.20805558],
       [ 0.38826733],
       [-0.67992318],
       [-0.819682  ],
       [-0.18220005],
       [-0.1647296 ],
       [-0.27437199],
       [ 1.52415097],
       [ 0.80834783],
       [ 0.54360419],
       [ 1.33736049],
       [-2.22028198],
       [-0.53716202],
       [-3.33133071],
       [ 0.02567355],
       [-0.90405335],
       [-1.26884617],
       [-3.03271921],
       [-0.87246159],
       [-0.86043787],
       [ 0.83300092],
       [-1.52452591],
       [-0.5437913 ],
       [ 2.17092195],
       [-0.50819959],
       [-0.84526105],
       [ 0.03153603],
       [-0.9748441 ],
       [-0.45361931],
       [-0.43091817],
       [-0.57319906],
       [-0.63619132],
       [ 0.75722195],
       [ 0.71109085],
       [-1.38667905],
       [-0.04297198],
       [ 0.42028346],
       [-0.2517879 ],
       [ 2.67056034],
       [-0.17628291],
       [-1.95496794]])
X.shape
(50, 1)
y
array([ -13.43582581,  -37.71318709,  -26.7038709 ,   28.89044381,
         80.83720026,  -22.01515484,   39.61567569,  -40.63131744,
         83.98564772,  108.02187692,   34.71807587,  -60.79735032,
        -73.29430019,  -16.29195804,  -14.72978653,  -24.53378629,
        136.28648463,   72.28082116,   48.60798302,  119.58405937,
       -198.53310623,  -48.03193734, -297.88082665,    2.29567689,
        -80.8386151 , -113.45764779, -271.17959352,  -78.01374335,
        -76.93860658,   74.48525081, -136.32001068,  -48.62471396,
        194.11943247,  -45.44217495,  -75.58152675,    2.81988733,
        -87.16857999,  -40.56171776,  -38.53182755,  -51.25429569,
        -56.88693572,   67.70924927,   63.58429958, -123.99402449,
         -3.84246716,   37.58089326,  -22.51436272,  238.79608281,
        -15.76286018, -174.8092634 ])
y.shape
(50,)
pd.DataFrame({"col0": X, "col1": y})
---------------------------------------------------------------------------
ValueError                                Traceback (most recent call last)
Cell In [11], line 1
----> 1 pd.DataFrame({"col0": X, "col1": y})

File /shared-libs/python3.9/py/lib/python3.9/site-packages/pandas/core/frame.py:529, in DataFrame.__init__(self, data, index, columns, dtype, copy)
    524     mgr = self._init_mgr(
    525         data, axes={"index": index, "columns": columns}, dtype=dtype, copy=copy
    526     )
    528 elif isinstance(data, dict):
--> 529     mgr = init_dict(data, index, columns, dtype=dtype)
    530 elif isinstance(data, ma.MaskedArray):
    531     import numpy.ma.mrecords as mrecords

File /shared-libs/python3.9/py/lib/python3.9/site-packages/pandas/core/internals/construction.py:287, in init_dict(data, index, columns, dtype)
    281     arrays = [
    282         arr if not isinstance(arr, ABCIndexClass) else arr._data for arr in arrays
    283     ]
    284     arrays = [
    285         arr if not is_datetime64tz_dtype(arr) else arr.copy() for arr in arrays
    286     ]
--> 287 return arrays_to_mgr(arrays, data_names, index, columns, dtype=dtype)

File /shared-libs/python3.9/py/lib/python3.9/site-packages/pandas/core/internals/construction.py:85, in arrays_to_mgr(arrays, arr_names, index, columns, dtype, verify_integrity)
     82         index = ensure_index(index)
     84     # don't force copy because getting jammed in an ndarray anyway
---> 85     arrays = _homogenize(arrays, index, dtype)
     87     columns = ensure_index(columns)
     88 else:

File /shared-libs/python3.9/py/lib/python3.9/site-packages/pandas/core/internals/construction.py:355, in _homogenize(data, index, dtype)
    353                 val = dict(val)
    354             val = lib.fast_multiget(val, oindex._values, default=np.nan)
--> 355         val = sanitize_array(
    356             val, index, dtype=dtype, copy=False, raise_cast_failure=False
    357         )
    359     homogenized.append(val)
    361 return homogenized

File /shared-libs/python3.9/py/lib/python3.9/site-packages/pandas/core/construction.py:529, in sanitize_array(data, index, dtype, copy, raise_cast_failure)
    527 elif subarr.ndim > 1:
    528     if isinstance(data, np.ndarray):
--> 529         raise ValueError("Data must be 1-dimensional")
    530     else:
    531         subarr = com.asarray_tuplesafe(data, dtype=dtype)

ValueError: Data must be 1-dimensional
df = pd.DataFrame({"col0": X.reshape(-1), "col1": y})
alt.Chart(df).mark_circle().encode(
    x="col0",
    y="col1"
)
Using noise and bias in make_regression#
def make_chart(X,y):
    df = pd.DataFrame({"col0": X.reshape(-1), "col1": y})
    chart = alt.Chart(df).mark_circle().encode(
        x="col0",
        y="col1"
    )
    return chart
X, y = make_regression(n_samples=50, n_features=1, noise=10, bias=-14.5)
make_chart(X,y)
X, y = make_regression(n_samples=50, n_features=1, noise=10, bias=-14.5)
make_chart(X,y)
X, y = make_regression(n_samples=50, n_features=1, noise=10, bias=-14.5, random_state=1234)
make_chart(X,y)
X, y = make_regression(n_samples=50, n_features=1, noise=10, bias=-14.5, random_state=1234, coef=True)
make_chart(X,y)
---------------------------------------------------------------------------
ValueError                                Traceback (most recent call last)
Cell In [42], line 1
----> 1 X, y = make_regression(n_samples=50, n_features=1, noise=10, bias=-14.5, random_state=1234, coef=True)
      2 make_chart(X,y)

ValueError: too many values to unpack (expected 2)
X, y, m = make_regression(n_samples=50, n_features=1, noise=10, bias=-14.5, random_state=1234, coef=True)
make_chart(X,y)
m
array(79.05241331)
Estimating the coefficient and bias using LinearRegression from scikit-learn#
X, y, m = make_regression(n_samples=50, n_features=1, noise=10, bias=-14.5, random_state=1234, coef=True)
make_chart(X,y)
from sklearn.linear_model import LinearRegression
reg = LinearRegression()
type(reg)
sklearn.linear_model._base.LinearRegression
reg.coef_
---------------------------------------------------------------------------
AttributeError                            Traceback (most recent call last)
Cell In [18], line 1
----> 1 reg.coef_

AttributeError: 'LinearRegression' object has no attribute 'coef_'
reg.intercept_
---------------------------------------------------------------------------
AttributeError                            Traceback (most recent call last)
Cell In [19], line 1
----> 1 reg.intercept_

AttributeError: 'LinearRegression' object has no attribute 'intercept_'
reg.fit(X,y)
LinearRegression()In a Jupyter environment, please rerun this cell to show the HTML representation or trust the notebook.
On GitHub, the HTML representation is unable to render, please try loading this page with nbviewer.org.
LinearRegression()
reg.coef_
array([80.25327575])
reg.intercept_
-12.675241213173738
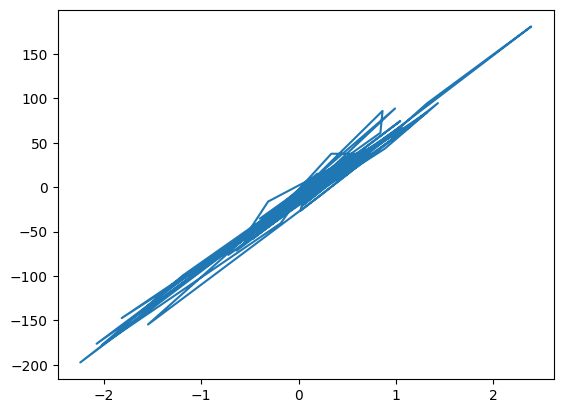
Plotting using Matplotlib#
import matplotlib.pyplot as plt
fig, ax = plt.subplots()
ax.plot(X,y)
[<matplotlib.lines.Line2D at 0x7fec7f4bdfd0>]
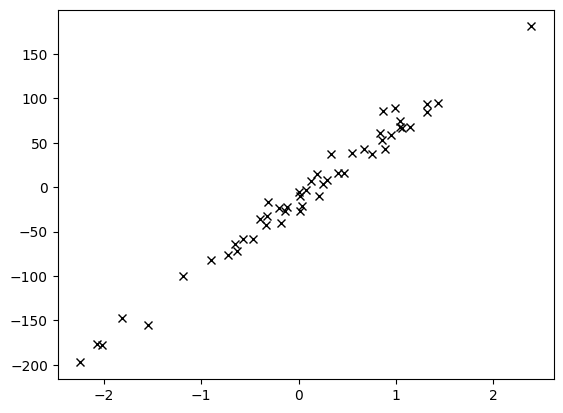
fig, ax = plt.subplots()
ax.plot(X,y, 'kx')
[<matplotlib.lines.Line2D at 0x7fec7f319280>]
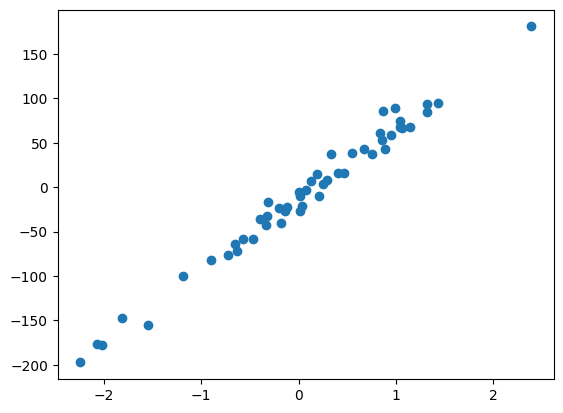
fig, ax = plt.subplots()
ax.scatter(X,y)
<matplotlib.collections.PathCollection at 0x7fecade860a0>
plt.style.available
['Solarize_Light2',
 '_classic_test_patch',
 '_mpl-gallery',
 '_mpl-gallery-nogrid',
 'bmh',
 'classic',
 'dark_background',
 'fast',
 'fivethirtyeight',
 'ggplot',
 'grayscale',
 'seaborn-v0_8',
 'seaborn-v0_8-bright',
 'seaborn-v0_8-colorblind',
 'seaborn-v0_8-dark',
 'seaborn-v0_8-dark-palette',
 'seaborn-v0_8-darkgrid',
 'seaborn-v0_8-deep',
 'seaborn-v0_8-muted',
 'seaborn-v0_8-notebook',
 'seaborn-v0_8-paper',
 'seaborn-v0_8-pastel',
 'seaborn-v0_8-poster',
 'seaborn-v0_8-talk',
 'seaborn-v0_8-ticks',
 'seaborn-v0_8-white',
 'seaborn-v0_8-whitegrid',
 'tableau-colorblind10']
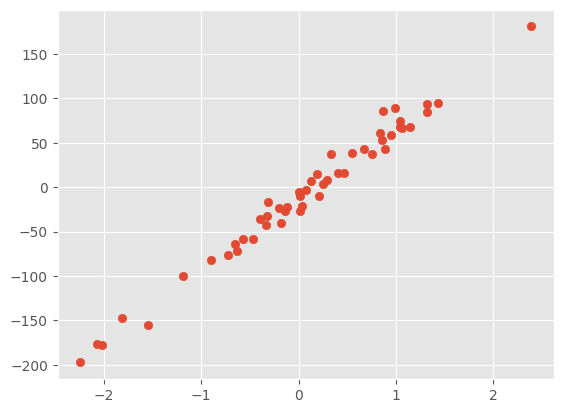
plt.style.use('ggplot')
fig, ax = plt.subplots()
ax.scatter(X,y)
<matplotlib.collections.PathCollection at 0x7fecade66f10>
import numpy as np
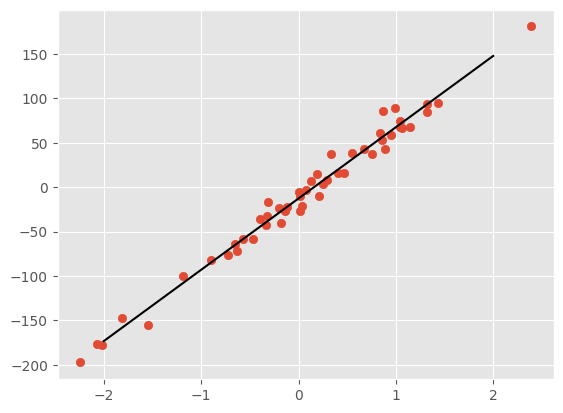
Xtrue = np.array([-2,2]).reshape(-1,1)
ytrue = reg.predict(Xtrue)
ytrue
array([-173.18179271, 147.83131029])
fig, ax = plt.subplots()
ax.scatter(X,y)
ax.plot(Xtrue, ytrue, 'k')
[<matplotlib.lines.Line2D at 0x7fecad723bb0>]
reg.predict(np.array([-2,2]))
---------------------------------------------------------------------------
ValueError                                Traceback (most recent call last)
Cell In [37], line 1
----> 1 reg.predict(np.array([-2,2]))

File /shared-libs/python3.9/py/lib/python3.9/site-packages/sklearn/linear_model/_base.py:386, in LinearModel.predict(self, X)
    372 def predict(self, X):
    373     """
    374     Predict using the linear model.
    375
   (...)
    384         Returns predicted values.
    385     """
--> 386     return self._decision_function(X)

File /shared-libs/python3.9/py/lib/python3.9/site-packages/sklearn/linear_model/_base.py:369, in LinearModel._decision_function(self, X)
    366 def _decision_function(self, X):
    367     check_is_fitted(self)
--> 369     X = self._validate_data(X, accept_sparse=["csr", "csc", "coo"], reset=False)
    370     return safe_sparse_dot(X, self.coef_.T, dense_output=True) + self.intercept_

File /shared-libs/python3.9/py/lib/python3.9/site-packages/sklearn/base.py:577, in BaseEstimator._validate_data(self, X, y, reset, validate_separately, **check_params)
    575     raise ValueError("Validation should be done on X, y or both.")
    576 elif not no_val_X and no_val_y:
--> 577     X = check_array(X, input_name="X", **check_params)
    578     out = X
    579 elif no_val_X and not no_val_y:

File /shared-libs/python3.9/py/lib/python3.9/site-packages/sklearn/utils/validation.py:879, in check_array(array, accept_sparse, accept_large_sparse, dtype, order, copy, force_all_finite, ensure_2d, allow_nd, ensure_min_samples, ensure_min_features, estimator, input_name)
    877     # If input is 1D raise error
    878     if array.ndim == 1:
--> 879         raise ValueError(
    880             "Expected 2D array, got 1D array instead:\narray={}.\n"
    881             "Reshape your data either using array.reshape(-1, 1) if "
    882             "your data has a single feature or array.reshape(1, -1) "
    883             "if it contains a single sample.".format(array)
    884         )
    886 if dtype_numeric and array.dtype.kind in "USV":
    887     raise ValueError(
    888         "dtype='numeric' is not compatible with arrays of bytes/strings."
    889         "Convert your data to numeric values explicitly instead."
    890     )

ValueError: Expected 2D array, got 1D array instead:
array=[-2  2].
Reshape your data either using array.reshape(-1, 1) if your data has a single feature or array.reshape(1, -1) if it contains a single sample.
reg.predict(np.array([-2,2]).reshape(-1,1))
array([-173.18179271, 147.83131029])
 Created in Deepnote